


北半球夏季季节内振荡(the Boreal Summer IntraSeasonal Oscillation,BSISO)是热带北半球夏季季节内变化的主要模态[1-3],对热带和中纬度地区许多类型的极端天气和气候事件的发生有深远的影响[4-5].BSISO起源于印度洋,在暖池上空向东传播,在印度洋和太平洋上空存在明显的向北传播.BSISO的降水主要出现在北半球,西北⁃东南倾斜的整体降水带特征是其最显著的空间分布特征,但是BSISO降水带在空间上的分布并不连续,被MC上的大小岛屿割裂,岛屿上降水异常,比海洋上明显偏低,且和海洋上的降水并不同时发生.MC是由中南半岛、菲律宾群岛、印度尼西亚群岛、新几内亚岛等众多岛屿和中国南海及一系列浅海组成的区域,该地区地处太平洋、印度洋、亚洲、大洋洲的连接地带.观测分析表明,冬季的季节内振荡向东传播经过MC时往往会减弱,有时甚至在MC上消失[6-7],无法顺利穿越MC到达西太平洋.而夏季的季节内振荡经过更多陆地,MC也可能对BSISO有相似的作用,如阻碍BSISO的东北向传播.理解BSISO在经过MC时减弱的原因,对于理解BSISO的基本机制,帮助修正模式中的系统误差以及提高BSISO的模拟能力和预报效果都有重要的意义.
已有一些研究试图解释BSISO的传播机理,有研究认为纬向或经向风切变导致大气不稳定和BSISO的北向传播[8-9],而最近的水汽模态理论发现夏季的经向水汽梯度是BSISO传播和倾斜结构的关键[10],然而这些理论不能清楚地解释MC对BSISO传播过程的影响.也有使用全球气候模式开展BSISO的研究,但气候模式的对流参数化常导致对对流和降水模拟的偏差较大.在BSISO的传播过程中,MC区域的陆地可能起到一些作用.首先,比起印度洋和太平洋上的广阔水域,星罗棋布的岛屿使表面通量显著减少,进而削弱ISO[11-13];其次,地面摩擦与岛屿突出的地形减弱了低层风,改变了原本的大尺度环流[14-16].另外,陆地上的日循环增强可能会抑制海上中尺度对流系统,干扰ISO对流发展,并阻碍其传播[17-20].对于形态复杂的季节内振荡,探讨其机制成因的一个非常有效的工具是高精度对流允许数值模拟试验,例如,Zhou et al[21]针对MC对于冬季季节内振荡的传播影响开展了对流允许数值试验,发现岛屿的存在减弱了背景水汽,改变了背景水汽梯度,从而减弱了冬季季节内振荡.
过去的研究主要关注MC对冬季季节内振荡的阻碍作用,而关注BSISO的研究相对较少.针对此问题,本研究选取2020年8月至9月在MC观测到的一次BSISO事件作为研究对象,本次事件的对流在印度洋较活跃,但在MC区域明显偏弱,可能是受到了MC的影响.本研究开展数值模拟试验,通过改变MC区域地形的试验,考察陆地和岛屿地形对此次BSISO事件传播和强度的影响.
1 数据与方法
1.1 数据
1.2 模式设置
图1
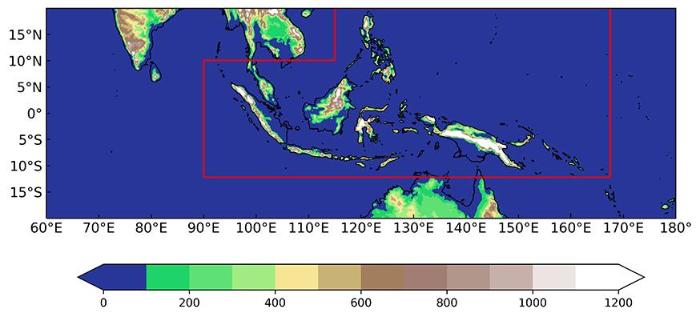
图1
WRF模式中模拟区域的地形高度(填色图,单位:m)
The red polygon indicates the areas of MC islands.
Fig.1
Simulation domain with terrain height (shading,unit: m) from the WRF model geography static data
数值模拟试验从2020年8月25日00时(UTC)开始,积分30 d至2020年9月25日00时结束.这项控制模拟试验的设置之后称为CNTL.为了研究MC区域地形对BSISO的影响,进行一项敏感性试验,将MC区域(图1中红框所示)地形高度设置为0,以抹平MC的地形,简称“No Topography”.
2 观测与模拟
2.1 案例概述
图2
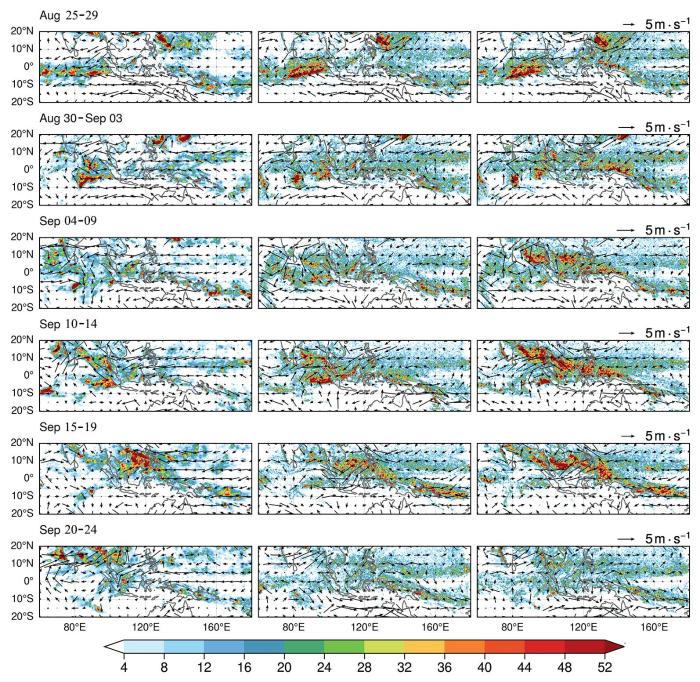
图2
观测(左列)、CNTL(中列)和No Topography试验(右列)在模拟期间的每五天平均的降水(填色图,单位:mm·d-1)和850 hPa风场距平场(矢量图,单位:m·s-1)
Fig.2
Precipitation (shading, unit: mm·d-1) and 850 hPa wind anomaly (vectors, unit: m·s-1) averaged of each 5 d during simulation period from observation (left), CNTL (middle) and No Topography experiment (right)
CNTL基本上准确模拟了以上发展过程,但也与观测有一些区别.例如,观测的最强降水主要集中在南海区域,而CNTL中的降水较分散.在雨带开始消散后,观测中北方陆地(10°~20°N,70°~110°E)降水较强,而CNTL中没有相似的模拟结果.在No Topography试验中,降水的位置演变与CNTL基本一致,但强度明显加强.9月4日前后,印度洋上空的气旋性环流显著加强.直至9月10日,倾斜雨带强度到达最大,位置较CNTL略偏北,并向西北方向延伸到印度次大陆上空.
2.2 平均态
图3展示了观测、CNTL和敏感性试验在整个模拟期间平均的降水量和柱状积分整层水汽(Column⁃integrated Water Vapor,CWV)的空间分布.观测与两组试验中降水量的空间分布具有相似性:在模拟期间,降水主要分布在印度洋和太平洋大尺度辐合带以及MC岛屿周围.对比图3a与图3c,CNTL中降水在苏门答腊岛以西的东印度洋(0°~5°S,90°~100°E)和新几内亚岛周围明显加强,而在印度次大陆附近降水量明显偏少.CNTL中降水强度小于观测,这可能是模式误差造成的.在No Topography试验中,抹平地形使降水量进一步加大,平均降水的倾斜结构更加明显,并且向西北方向延伸到印度次大陆上空.降水量在泰国湾北部出现了明显的增加,而在新几内亚岛和婆罗洲上空明显减少.这意味着抹平地形使得倾斜雨带出现了明显的加强和向北偏移.
图3
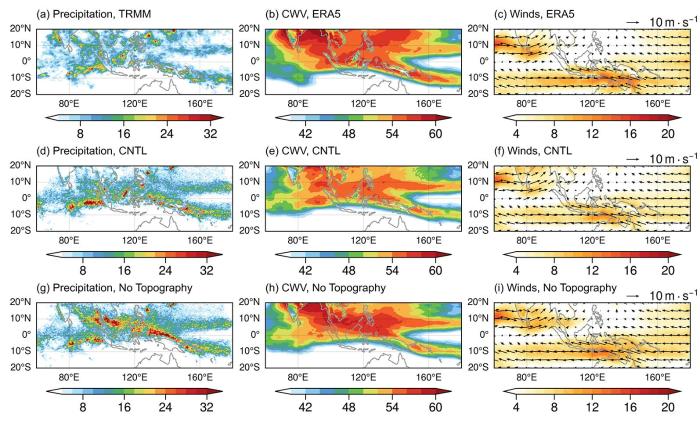
图3
(a)观测,(d) CNTL,(g) No Topography试验在模拟期间的平均降水(填色图,单位:mm·d-1);(b, e, h)和(c, f, i)分别为整层积分可降水量(填色图,单位:kg·m-2)和850 hPa风场(填色图,单位:m·s-1)
(d) CNTL, (g) No topography; (b, e, h) are the same as in (a, d) and (g), but for averaged CWV (unit: kg·m-2),
and (c, f, i) are the same as in (a, d) and (g), but for averaged wind at 850 hPa (unit: m·s-1), respectively
Fig.3
Daily precipitation (shading, unit: mm·d-1) averaged during the simulation period from (a) observation,
2.3 传播特征
来自观测和WRF模拟的0°~5°N的平均降水和850 hPa纬向风的时间⁃经度图(图4)显示了本次BSISO事件的大规模向东传播特征.对流信号在9月7日抵达MC西侧(~90°E)后快速减弱,并且受到岛屿的影响,降水信号在MC上空的传播出现不连续.降水信号在9月13日前后抵达西太平洋.降水在MC上空(95°~125°E)维持的时间较长.
图4

图4
观测/再分析的0°~5°N平均日降水量(填色图,单位:mm·d-1)和850 hPa纬向风异常(等值线图,单位:m·s-1)时间⁃经度平均图.(a, c, d)分别为观测、CNTL和No Topography试验, (b, e, f)分别为5°~10°N的观测、CNTL和No Topography试验
(e) CNTL, and (f) No Topography are the time⁃longitude diagrams of 5°~10°N
Fig.4
The time⁃longitude diagrams of 0°~5°N averaged daily precipitation (shading, unit: mm·d-1) and 850 hPa zonal wind anomaly (contours, unit: m·s-1) from (a) observation, (c) CNTL, and (d) No topography; (b) observation,
在对流层低层,印度洋和MC上空经历了东风异常到西风异常的转变.低层西风异常信号滞后降水信号2~3 d.西风异常在向东经过苏门答腊岛(~100°E)时减弱,而后在泰国湾上空(~105°E)再度加强.西风异常在9月16日附近传播到婆罗洲以东后不再继续向东移动,MC以东受到东风异常控制.之后,东风异常不断西伸,直到9月19日控制整个印度⁃太平洋地区.
图5
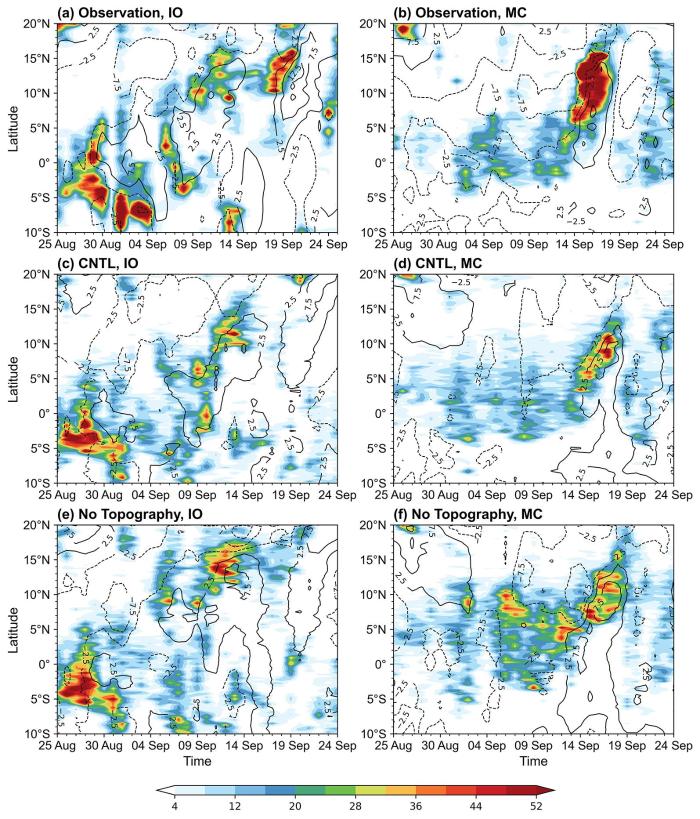
图5
印度洋(左列)和MC(右列)的平均日降水量(填色图,单位:mm·d-1)和850 hPa纬向风异常(等值线图,单位:m·s-1)时间⁃纬度平均图, (a, b) (c, d) (e, f)分别为观测、CNTL和No Topography试验
Fig.5
The time⁃latitude diagrams of Indian Ocean (80°~90°E) averaged daily precipitation (shading, unit: mm·d-1) and 850 hPa zonal wind anomaly (contours, unit: m·s-1) from (a) Observation, (c) CNTL, and (e) No topography; (b, d, f) are the same as in (a, c, e) but for Maritime Continent (110°~120°E)
CNTL中印度洋区域降水和纬向风异常的传播情况与观测大致一致,但9月17日之后并未出现加强的降水信号,纬向风信号也较观测偏弱.No Topography试验中,降水量和风速加强,但直到9月8日之后才在~10°N发现明显的北向传播信号.No Topography试验中,信号传播得更北,接近模拟区域的北部边界.
在MC区域,CNTL模拟的降水量相比观测偏小,抹平地形后降水量略有增加.No Topography试验中降水向北传播的持续时间更长,传播得更远.但模拟出的强度依然弱于观测值.
3 结论
为了研究MC对于BSISO结构和传播的影响机制,选取2020年8-9月发生的一次BSISO事件,利用高精度WRF数值模式对本次过程进行了为期一个月的模拟,分析了MC的地形对本次BSISO事件强度以及传播的影响,得到以下主要结论.
(1)本次事件起于赤道偏南印度洋,沿着赤道向东移动,同时向北移动.在穿越MC之后向东北方向移动.9月初随着西风不断加强,从印度半岛到新几内亚岛上空形成西北⁃东南向倾斜的降雨带.9月4日后倾斜雨带不断加强,并逐渐向北移动,于9月15-19日达到最大值.直到9月20日之后开始减弱消散.
(2)CNTL合理地模拟了与再分析资料中相近的北传低层风场,以及明显具有BSISO特征的西北⁃东南倾斜的雨带,合理地捕捉了本次BSISO事件的平均状态和传播特征.
(3)为了研究MC地区地形对本次BSISO事件传播和强度的影响,在WRF模式中去除MC地区的地形,开展了敏感性试验.在去除地形的敏感性试验中,BSISO低空风加强,传播更加平滑,整体降水幅度增加;在岛屿上水汽大幅增加,降水量减少.这可能是因为岛屿突出的地形阻挡了低层风,减弱了水汽平流.抹平地形后改变了原本的低层风场,加强的风场将海洋上蒸发的水汽吹向陆地,导致岛屿上空水汽平流加强;婆罗洲与新几内亚岛上空原地形高度较高,抹平地形造成整层水汽含量增加,使得CWV值的空间分布更加平滑.而降水减少可能是因为去除地形会使得地形抬升产生的降水减少,并减弱岛屿上机械和/或热强迫导致的日循环.在地形高度为零的情况下,海上对流增强,促进了BSISO的加强和传播.此数值模拟试验研究揭示了MC地形对BSISO降水结构、传播和强度的影响.
本研究也存在一定的局限性,例如,数值模拟研究由于计算资源的限制也仅限于单个个例,有关结论是否能够推广到其他的BSISO事件有待考察.另外,BSISO是一个大尺度的模态,控制试验和敏感性试验的结果也有可能会受到模式侧边界条件的影响,例如来自东边界太平洋地区天气尺度的扰动等,将侧边界的影响分离开也需要进一步开展数值试验.
参考文献
The 30-50 day mode at 850 mb during MONEX
Synoptic climatology of transient tropical intraseasonal convection anomalies:1975-1985
The Boreal Summer Intraseasonal Oscillation (BSISO):A review
Propagation pathways of Indo⁃Pacific rainfall extremes are modulated by Pacific sea surface temperatures
The Indian monsoon,GDP and agriculture
Barrier effect of the Indo⁃Pacific Maritime Continent on the MJO:Perspectives from tracking MJO precipitation
The interaction of the Madden⁃Julian Oscillation with the Maritime Continent in a GCM
Structures and mechanisms of the northward propagating boreal summer intraseasonal oscillation
A unified moisture mode theory for the Madden–Julian oscillation and the boreal summer intraseasonal oscillation
Surface fluxes and ocean coupling in the tropical intraseasonal oscillation
The role of surface heat fluxes in tropical intraseasonal oscillations
Surface fluxes and tropical intraseasonal variability:A reassessment
Influence of boreal summer intraseasonal oscillation on rainfall extremes in southern China
Topographic influence on the MJO in the Maritime Continent
Role of topography on the MJO in the Maritime Continent:A numerical case study
Why precipitation is mostly concentrated over islands in the Maritime Continent
Impact of MJO on the diurnal cycle of rainfall over the western Maritime Continent in the austral summer
Island precipitation enhancement and the diurnal cycle in radiative⁃convective equilibrium
Factors controlling rain on small tropical islands:Diurnal cycle,large⁃scale wind speed,and topography
Impact of islands on the MJO propagation across the Maritime Continent:A numerical modeling study of an MJO event
ERA5 hourly data on pressure levels from 1940 to present
ERA5 hourly data on single levels from 1940 to present
The TRMM Multisatellite Precipitation Analysis (TMPA):Quasi-global,multiyear,combined⁃sensor precipitation estimates at fine scales
A description of the advanced research WRF model version 4.3
Implementation and verification of the unified NOAH land⁃surface model in the WRF model
∥
A thermal infrared radiation parameterization for atmospheric studies
A new vertical diffusion package with an explicit treatment of entrainment processes
Development of an effective double–moment cloud microphysics scheme with prognostic cloud condensation nuclei (CCN) for weather and climate models
A unified moisture mode framework for seasonality of the Madden⁃Julian oscillation
