南京大学学报(自然科学版) ›› 2024, Vol. 60 ›› Issue (2): 244–256.doi: 10.13232/j.cnki.jnju.2024.02.006
• • 上一篇
台风结构与强度以及环境场对西北太平洋台风尺度估计的影响研究
李好雨, 储可宽( )
)
- 中尺度灾害性天气教育部重点实验室,南京大学大气科学学院,南京,210023
The impact of typhoon structure, intensity, and environmental factors on the estimation of typhoon size in the Northwest Pacific
Haoyu Li, Kekuan Chu()
- Key Laboratory of Mesoscale Severe Weather,Ministry of Education,and School of Atmospheric Sciences,Nanjing University,Nanjing,210023,China
摘要:
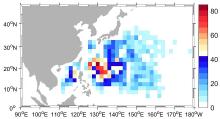
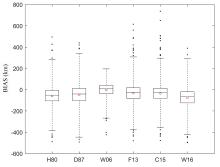
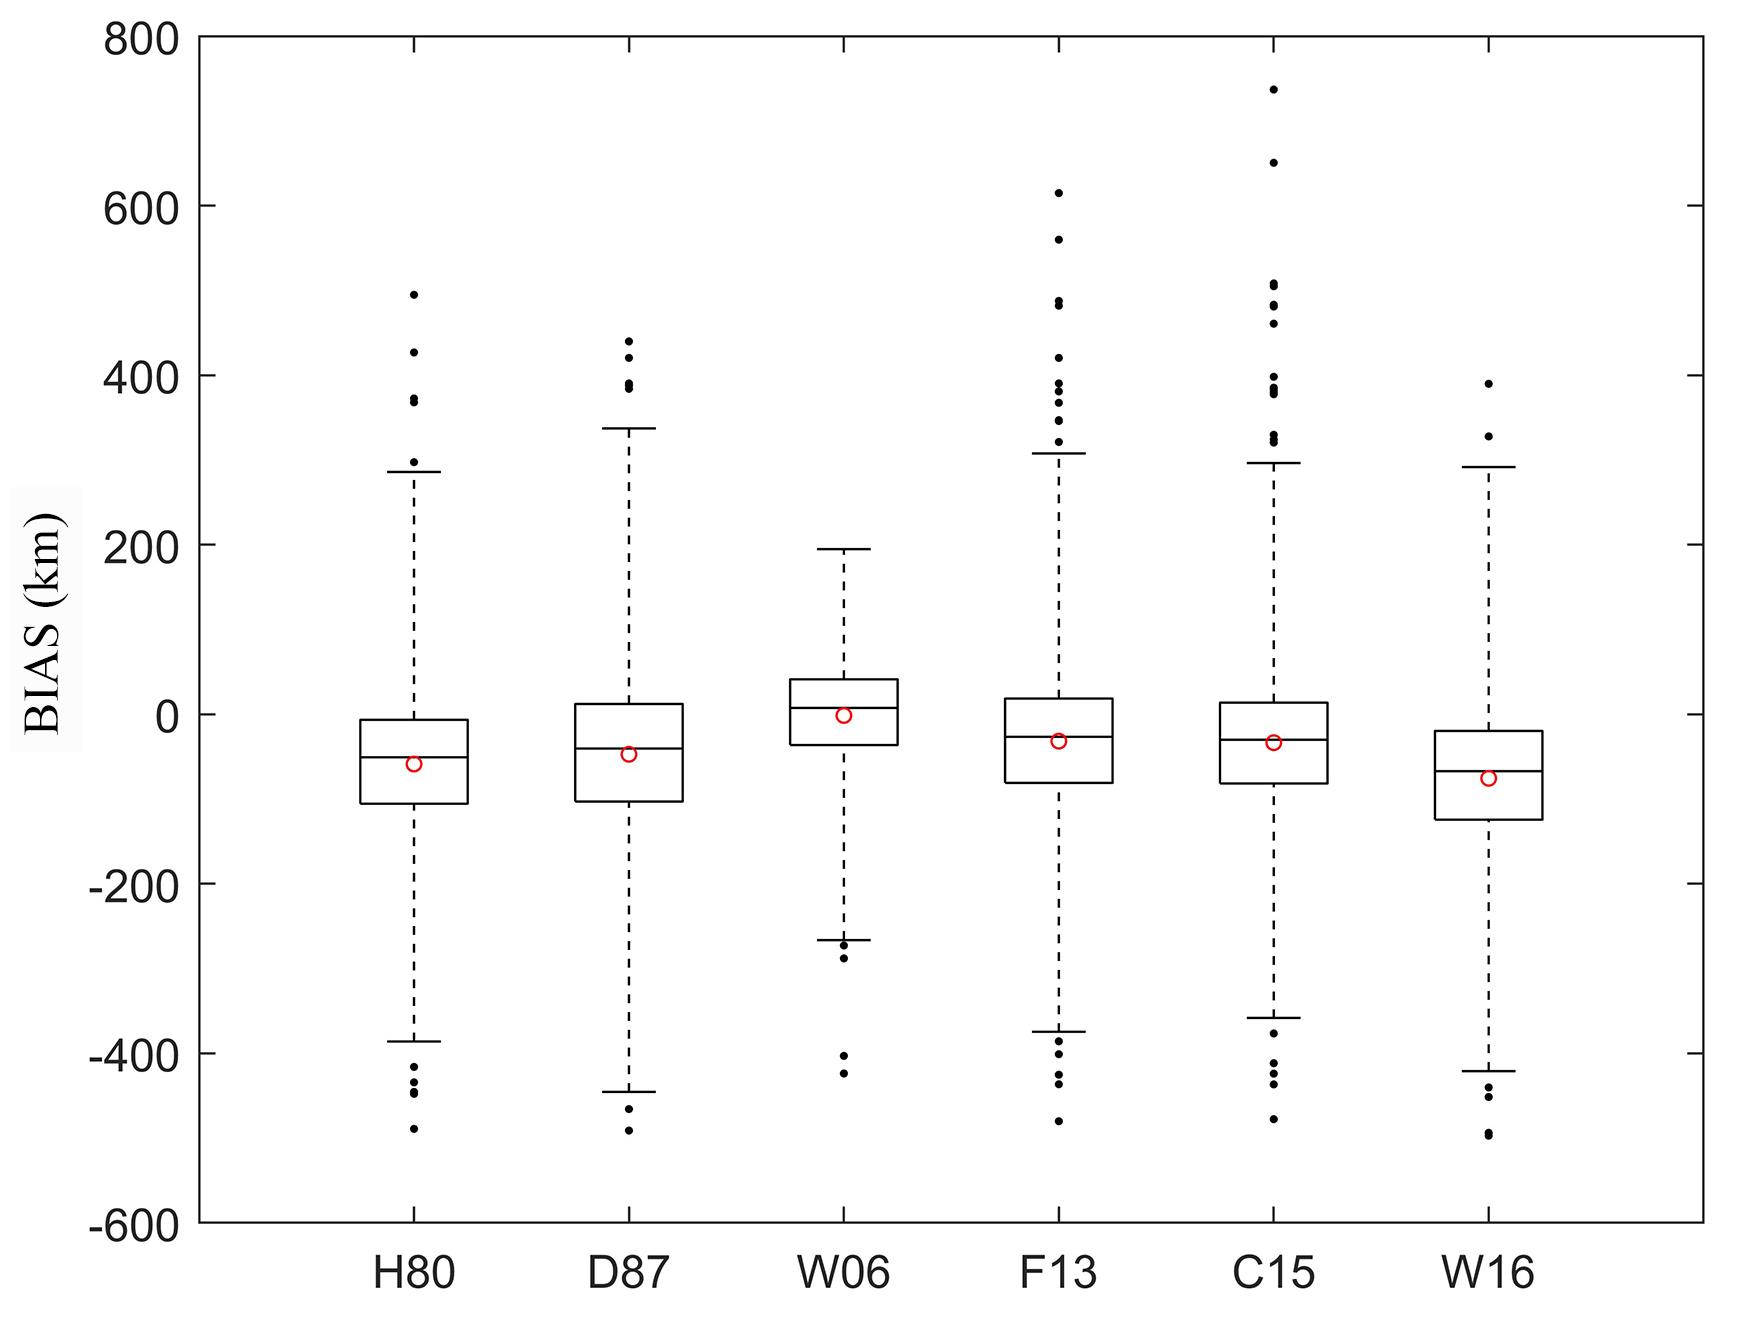
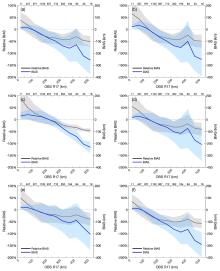
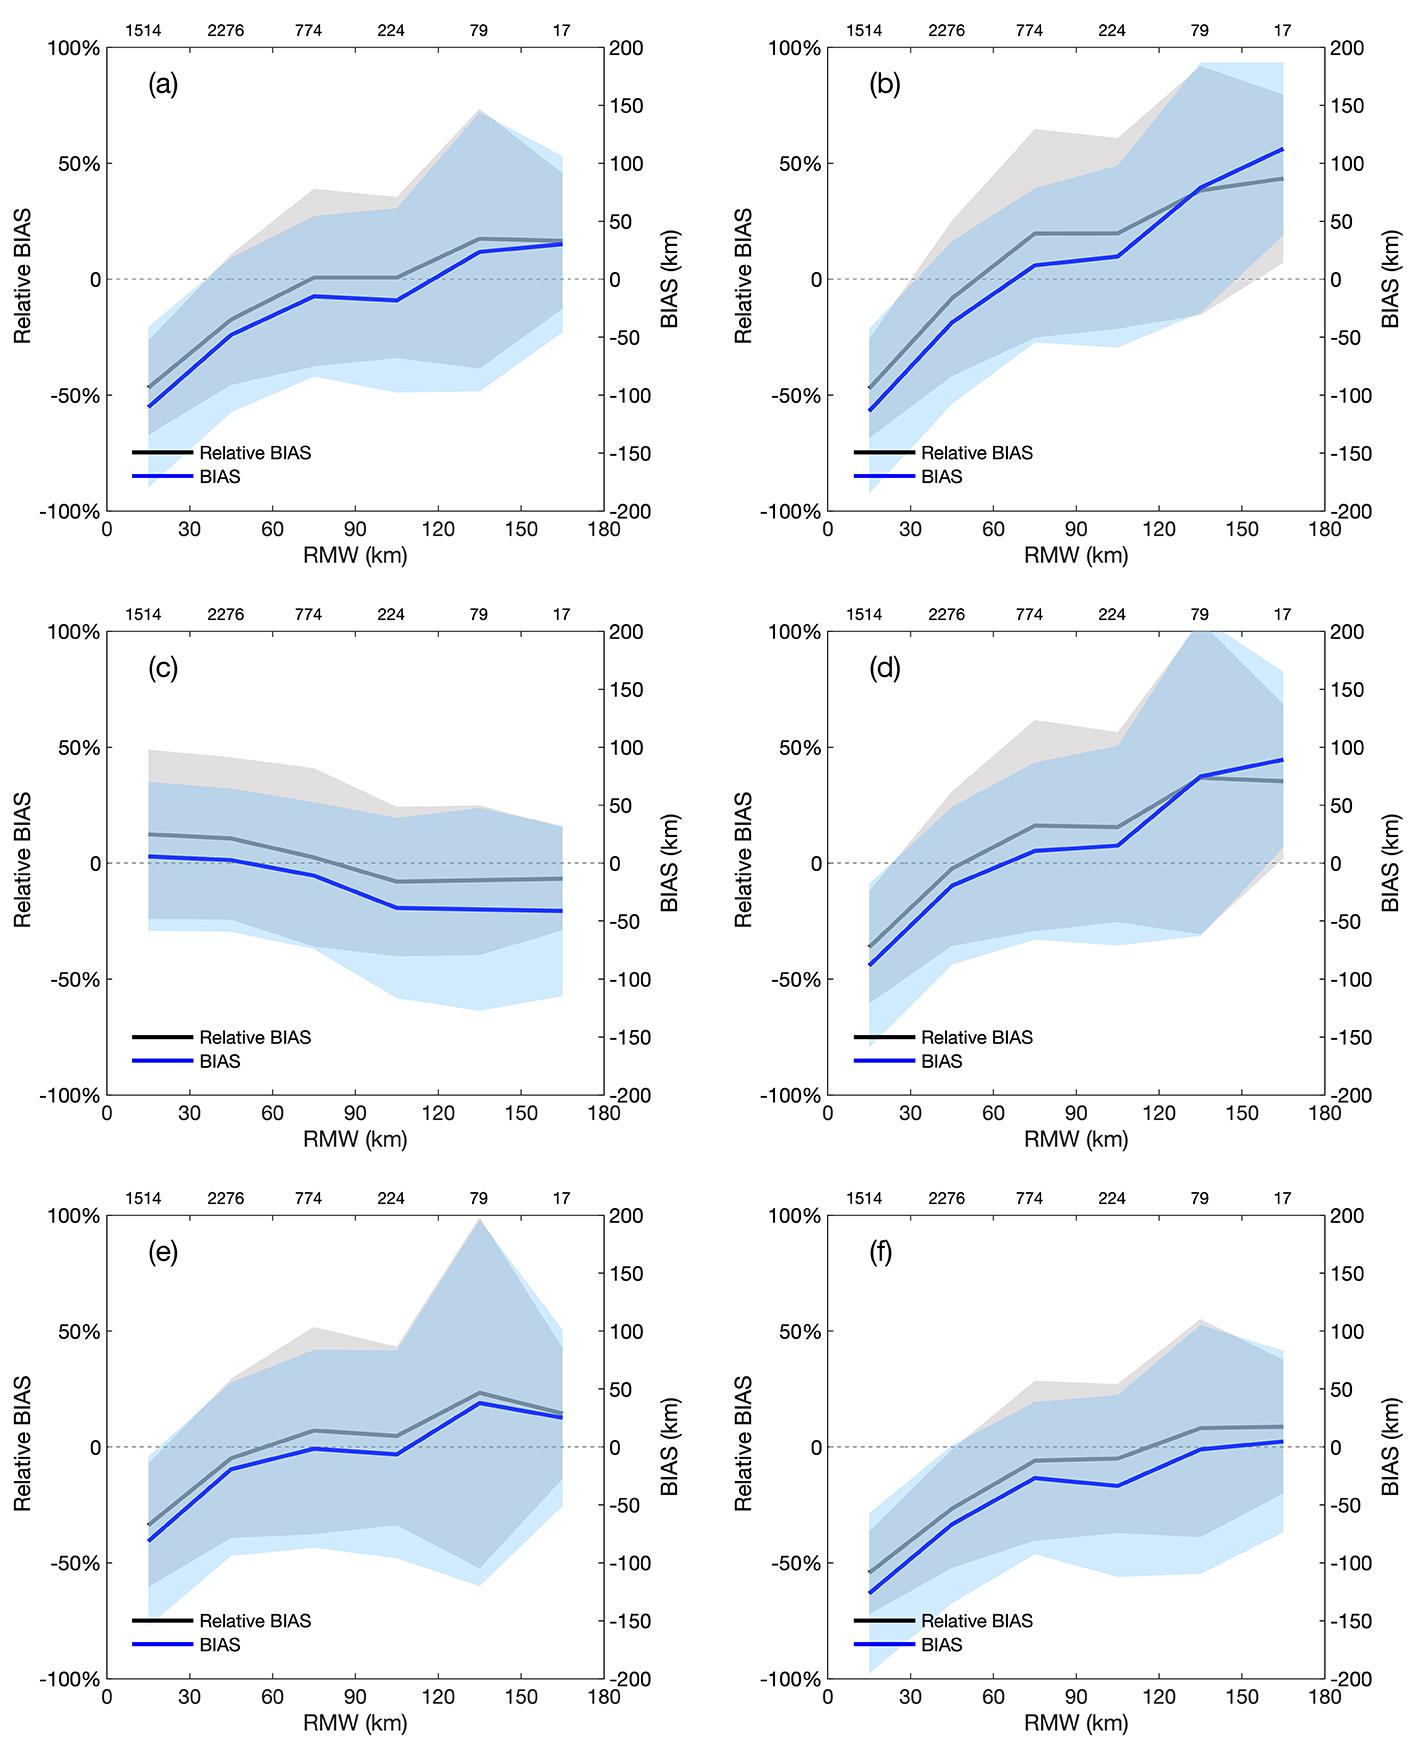
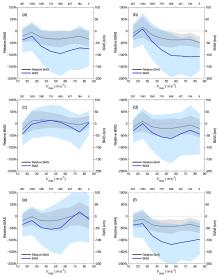
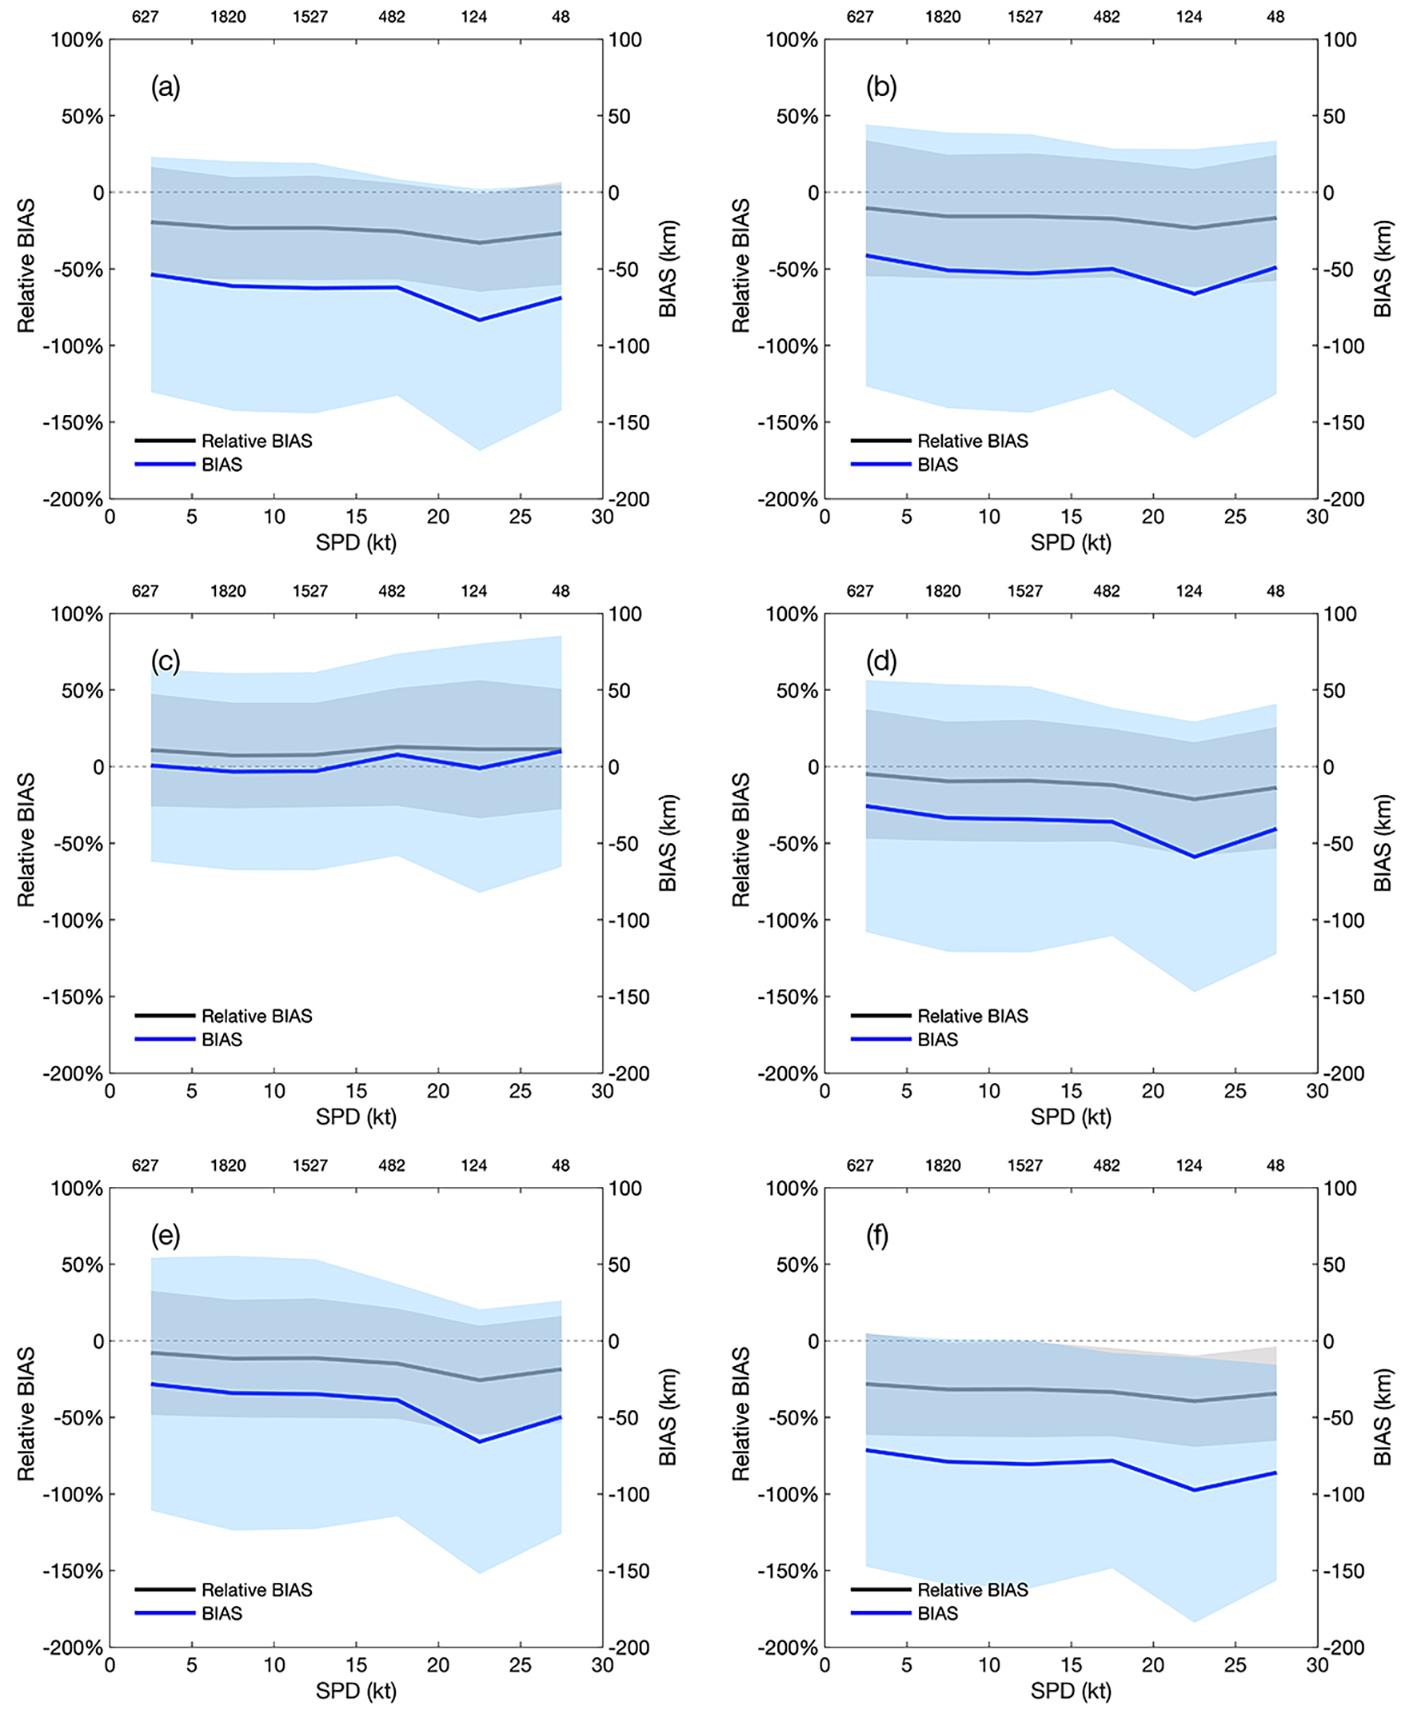
台风风场径向廓线模型对台风灾害的评估以及台风尺度的研究具有重要的价值.利用西北太平洋2001-2020年的台风最佳路径观测数据,评估了目前国际上应用比较广泛的六个分别基于经验参数和物理过程的台风风场径向廓线模型对台风尺度(台风大风半径,R17)的估计精度,并探讨了台风结构、强度等内部因素以及垂直风切变和移动速度等环境因子对模型精度的影响.评估发现,所有模型均高估了R17较小的台风而低估了R17较大的台风,且R17越小,高估越明显,R17越大,低估越严重.总体而言,Willoughby et al发展的基于参数的模型具有最小的估计偏差且与观测记录之间最高的相关性.研究还发现,台风内核尺度(最大风速半径,RMW)和强度(最大地面风速,Vmax)对不同模型的影响具有显著的差异性.此外,在高环境风切变和高移速条件下,模型的估计偏差的量级会显著增加.以上研究为进一步完善适用于不同环境条件下,不同结构与强度台风的风场模型提供参考.
中图分类号:
- P445


| 1 | Brand S. Very large and very small typhoons of the Western North Pacific Ocean. Journal of the Meteorological Society of Japan,1972,50(4):332-341. DOI:10.2151/jmsj1965.50.4_332 . |
| 2 | Dunnavan G M, Diercks J W. An analysis of super typhoon Tip (October 1979). Monthly Weather Review,1980,108(11):1915-1923. |
| 3 | Landsea C W, Franklin J L. Atlantic hurricane database uncertainty and presentation of a new database format. Monthly Weather Review,2013,141(10):3576-3592. |
| 4 | Holland G J. An analytic model of the wind and pressure profiles in hurricanes. Monthly Weather Review,1980,108(8):1212-1218. DOI:10.1175/1520-0493(1980)108 1212 : a a m o t w 2.0.co;2. |
| 5 | Demaria M. Tropical cyclone track prediction with a barotropic spectral model. Monthly Weather Review,1987,115(10):2346-2357. DOI:10.1175/1520-0493(1987)115 2346 : t c t p w a 2.0.co;2. |
| 6 | Willoughby H E, Darling R W R, Rahn M E. Parametric representation of the primary hurricane vortex. Part Ⅱ:A new family of sectionally continuous profiles. Monthly Weather Review,2006,134(4):1102-1120. DOI:10.1175/MWR3106.1 . |
| 7 | Knaff J,A, Sampson C R, Demaria M,et al. Statistical tropical cyclone wind radii prediction using climatology and persistence. Weather and Forecasting,2007,22(4):781-791. DOI:10.1175/waf1026.1 . |
| 8 | Emanuel K. Tropical cyclone energetics and structure∥Fedorovich E,Rotunno R,Stevens B. Atmospheric Turbulence and Mesoscale Meteorology. Cambridge,England:Cambridge University Press,2004:165-192. |
| 9 | Rotunno R, Emanuel K A. An air–sea interaction theory for tropical cyclones. Part Ⅱ:Evolutionary study using a nonhydrostatic axisymmetric numerical model. Journal of the Atmospheric Sciences,1987,44(3):542-561. DOI:10.1175/1520-0469(1987)044 0542 : A A I T F T 2.0.CO;2. |
| 10 | Emanuel K, Rotunno R. Self?stratification of tropical cyclone outflow. Part I:Implications for storm structure. Journal of the Atmospheric Sciences,2011,68(10):2236-2249. DOI:10.1175/JAS-D-10-05024.1 . |
| 11 | Morris M, Ruf C S. Determining tropical cyclone surface wind speed structure and intensity with the CYGNSS satellite constellation. Journal of Applied Meteorology and Climatology,2017,56(7):1847-1865. DOI:10.1175/JAMC-D-16-0375.1 . |
| 12 | Chavas D R, Lin N, Emanuel K. A model for the complete radial structure of the tropical cyclone wind field. Part I:Comparison with observed structure. Journal of the Atmospheric Sciences,2015,72(9):3647-3662. DOI:10.1175/JAS-D-15-0014.1 . |
| 13 | Frisius T, Sch?nemann D, Vigh J. The impact of gradient wind imbalance on potential intensity of tropical cyclones in an unbalanced slab boundary layer model. Journal of the Atmospheric Sciences,2013,70(7):1874-1890. DOI:10.1175/JAS-D-12-0160.1 . |
| 14 | Wang S, Toumi R. On the relationship between hurricane cost and the integrated wind profile. Environmental Research Letters,2016,11(11):114005. |
| 15 | Chan K T F, Chan J C L. Size and strength of tropical cyclones as inferred from QuikSCAT data. Monthly Weather Review,2012,140(3):811-824. |
| 16 | Chan K T F, Chan J C L. The outer?core wind structure of tropical cyclones. Journal of the Meteorological Society of Japan,2018,96(4):297-315. |
| 17 | Carrasco C A, Landsea C W, Lin Y L. The influence of tropical cyclone size on its intensification. Weather and Forecasting,2014,29(3):582-590. |
| 18 | Li M, Chu K K, Gu J F,et al. On the relationship between tropical cyclone size and environmental helicity in the South China Sea. Atmospheric and Oceanic Science Letters,2022,15(4):100205. |
| 19 | Bian G F, Nie G Z, Qiu X. How well is outer tropical cyclone size represented in the ERA5 reanalysis dataset? Atmospheric Research,2021,249:105339. |
| 20 | Pérez?Alarcón A, Sorí R, Fernández?Alvarez J C,et al. Comparative climatology of outer tropical cyclone size using radial wind profiles. Weather and Climate Extremes,2021,33:100366. |
| 21 | Wu L G, Tian W, Liu Q Y,et al. Implications of the observed relationship between tropical cyclone size and intensity over the western North Pacific. Journal of Climate,2015,28(24):9501-9506. |
| 22 | Chan K T F, Chan J C L. Impacts of vortex intensity and outer winds on tropical cyclone size. Quarterly Journal of the Royal Meteorological Society,2015,141(687):525-537. |
| 23 | Song J J, Duan Y H, Klotzbach P J. Revisiting the relationship between tropical cyclone size and intensity over the western North Pacific. Geophysical Research Letters,2020,47(13):e2020GL088217. |
| 24 | Lin Y L, Zhao M, Zhang M H. Tropical cyclone rainfall area controlled by relative sea surface temperature. Nature Communications,2015,6(1):6591. |
| 25 | Hill K A, Lackmann G M. Influence of environmental humidity on tropical cyclone size. Monthly Weather Review,2009,137(10):3294-3315. |
| 26 | Chen S S, Knaff J A, Marks F D. Effects of vertical wind shear and storm motion on tropical cyclone rainfall asymmetries deduced from TRMM. Monthly Weather Review,2006,134(11):3190-3208. |
| 27 | Chen B F, Davis C A, Kuo Y H. Effects of low?level flow orientation and vertical shear on the structure and intensity of tropical cyclones. Monthly Weather Review,2018,146(8):2447-2467. |
| 28 | Chan K T F, Chan J C L. Angular momentum transports and synoptic flow patterns associated with tropical cyclone size change. Monthly Weather Review,2013,141(11):3985-4007. |
| 29 | Kowaleski A M, Evans J L. A reformulation of tropical cyclone potential intensity theory incorporating energy production along a radial trajectory. Monthly Weather Review,2016,144(10):3569-3578. |
| 30 | Chen B F, Davis C A, Kuo Y H. An idealized numerical study of shear?relative low?level mean flow on tropical cyclone intensity and size. Journal of the Atmospheric Sciences,2019,76(8):2309-2334. |
| 31 | Chen B F, Davis C A, Kuo Y H. Examination of the combined effect of deep?layer vertical shear direction and lower?tropospheric mean flow on tropical cyclone intensity and size based on the ERA5 reanalysis. Monthly Weather Review,2021,149(12):4057-4076. |
| 32 | Tu S F, Chan J C L, Xu J J,et al. Increase in tropical cyclone rain rate with translation speed. Nature Communications,2022,13(1):7325. |
| [1] | 艾真珍, 董寅硕, 徐昕, 季玉枝, 衡志炜. 青藏高原东部地形对四川盆地东北部一次暴雨过程的影响[J]. 南京大学学报(自然科学版), 2024, 60(2): 209-217. |
| [2] | 张心怡, 张熠, 刘昊炎, 王其伟, 王迪. 模拟启动时间和双台风对“21.7”河南极端暴雨事件的影响研究[J]. 南京大学学报(自然科学版), 2024, 60(2): 194-208. |
|
||