南京大学学报(自然科学版) ›› 2024, Vol. 60 ›› Issue (2): 301–316.doi: 10.13232/j.cnki.jnju.2024.02.011
• • 上一篇
基于CMIP6模式对青藏高原平均降水的模拟评估与预估
季玉枝1,3, 杨小玲2,3( ), 周波涛3, 徐昕1, 王元1
- 1.中尺度灾害性天气教育部重点实验室,南京大学大气科学学院,南京,210023
2.江西信息应用职业技术学院,南昌,330043
3.气象灾害教育部重点实验室/气象灾害预报预警与评估协同创新中心,南京信息工程大学,南京,210044
CMIP6 evaluation and projection of precipitation over the Qinghai⁃Xizang Plateau
Yuzhi Ji1,3, Xiaoling Yang2,3(), Botao Zhou3, Xin Xu1, Yuan Wang1
- 1.Key Laboratory of Mesoscale Severe Weather,Ministry of Education,and School of Atmospheric Sciences,Nanjing University,Nanjing,210023,China
2.Jiangxi Vocational and Technical College of Information Application,Nanchang,330043,China
3.Key Laboratory of Meteorological Disaster,Ministry of Education/ Collaborative Innovation Center on Forecast and Evaluation of Meteorological Disasters,Nanjing University of Information Science and Technology,Nanjing,210044,China
摘要:
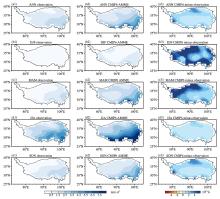
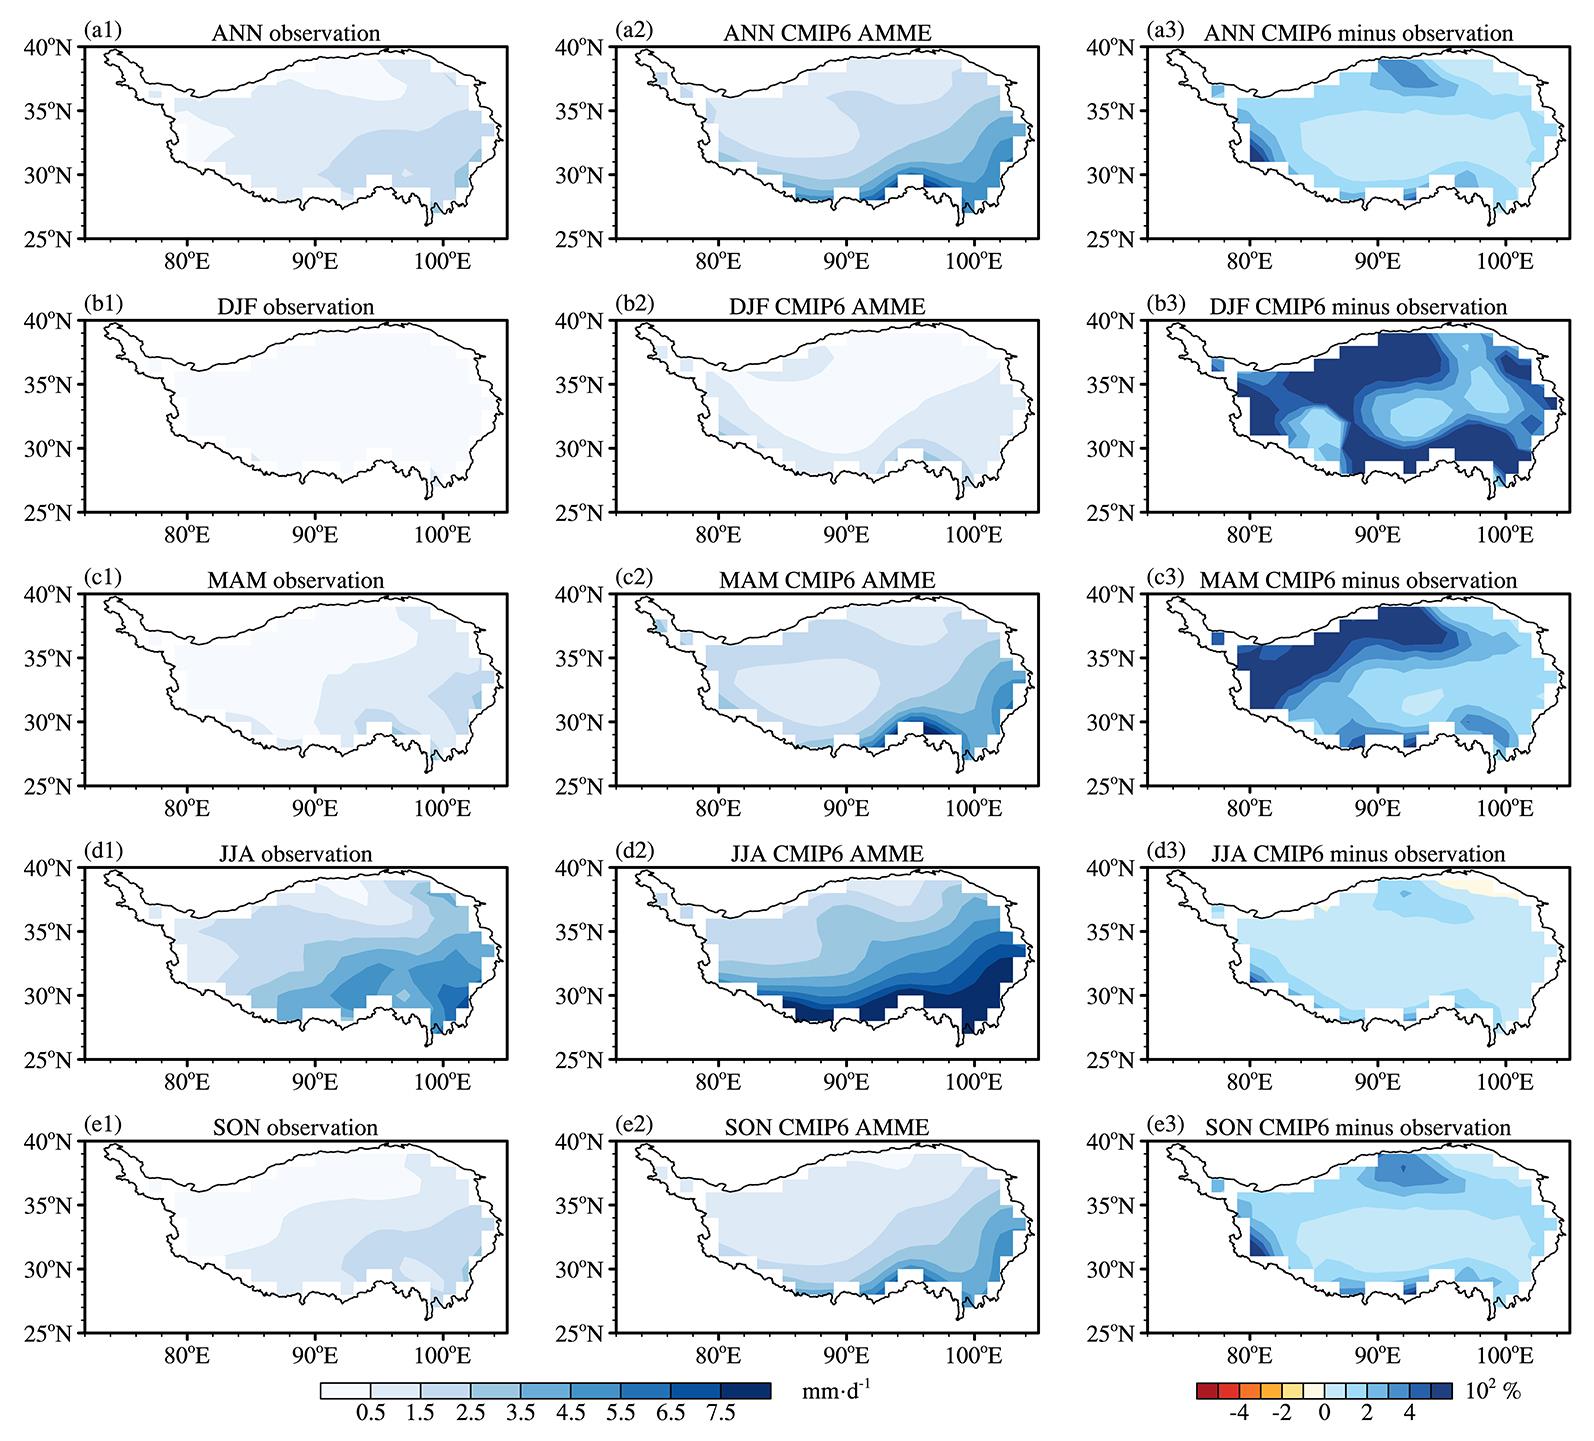
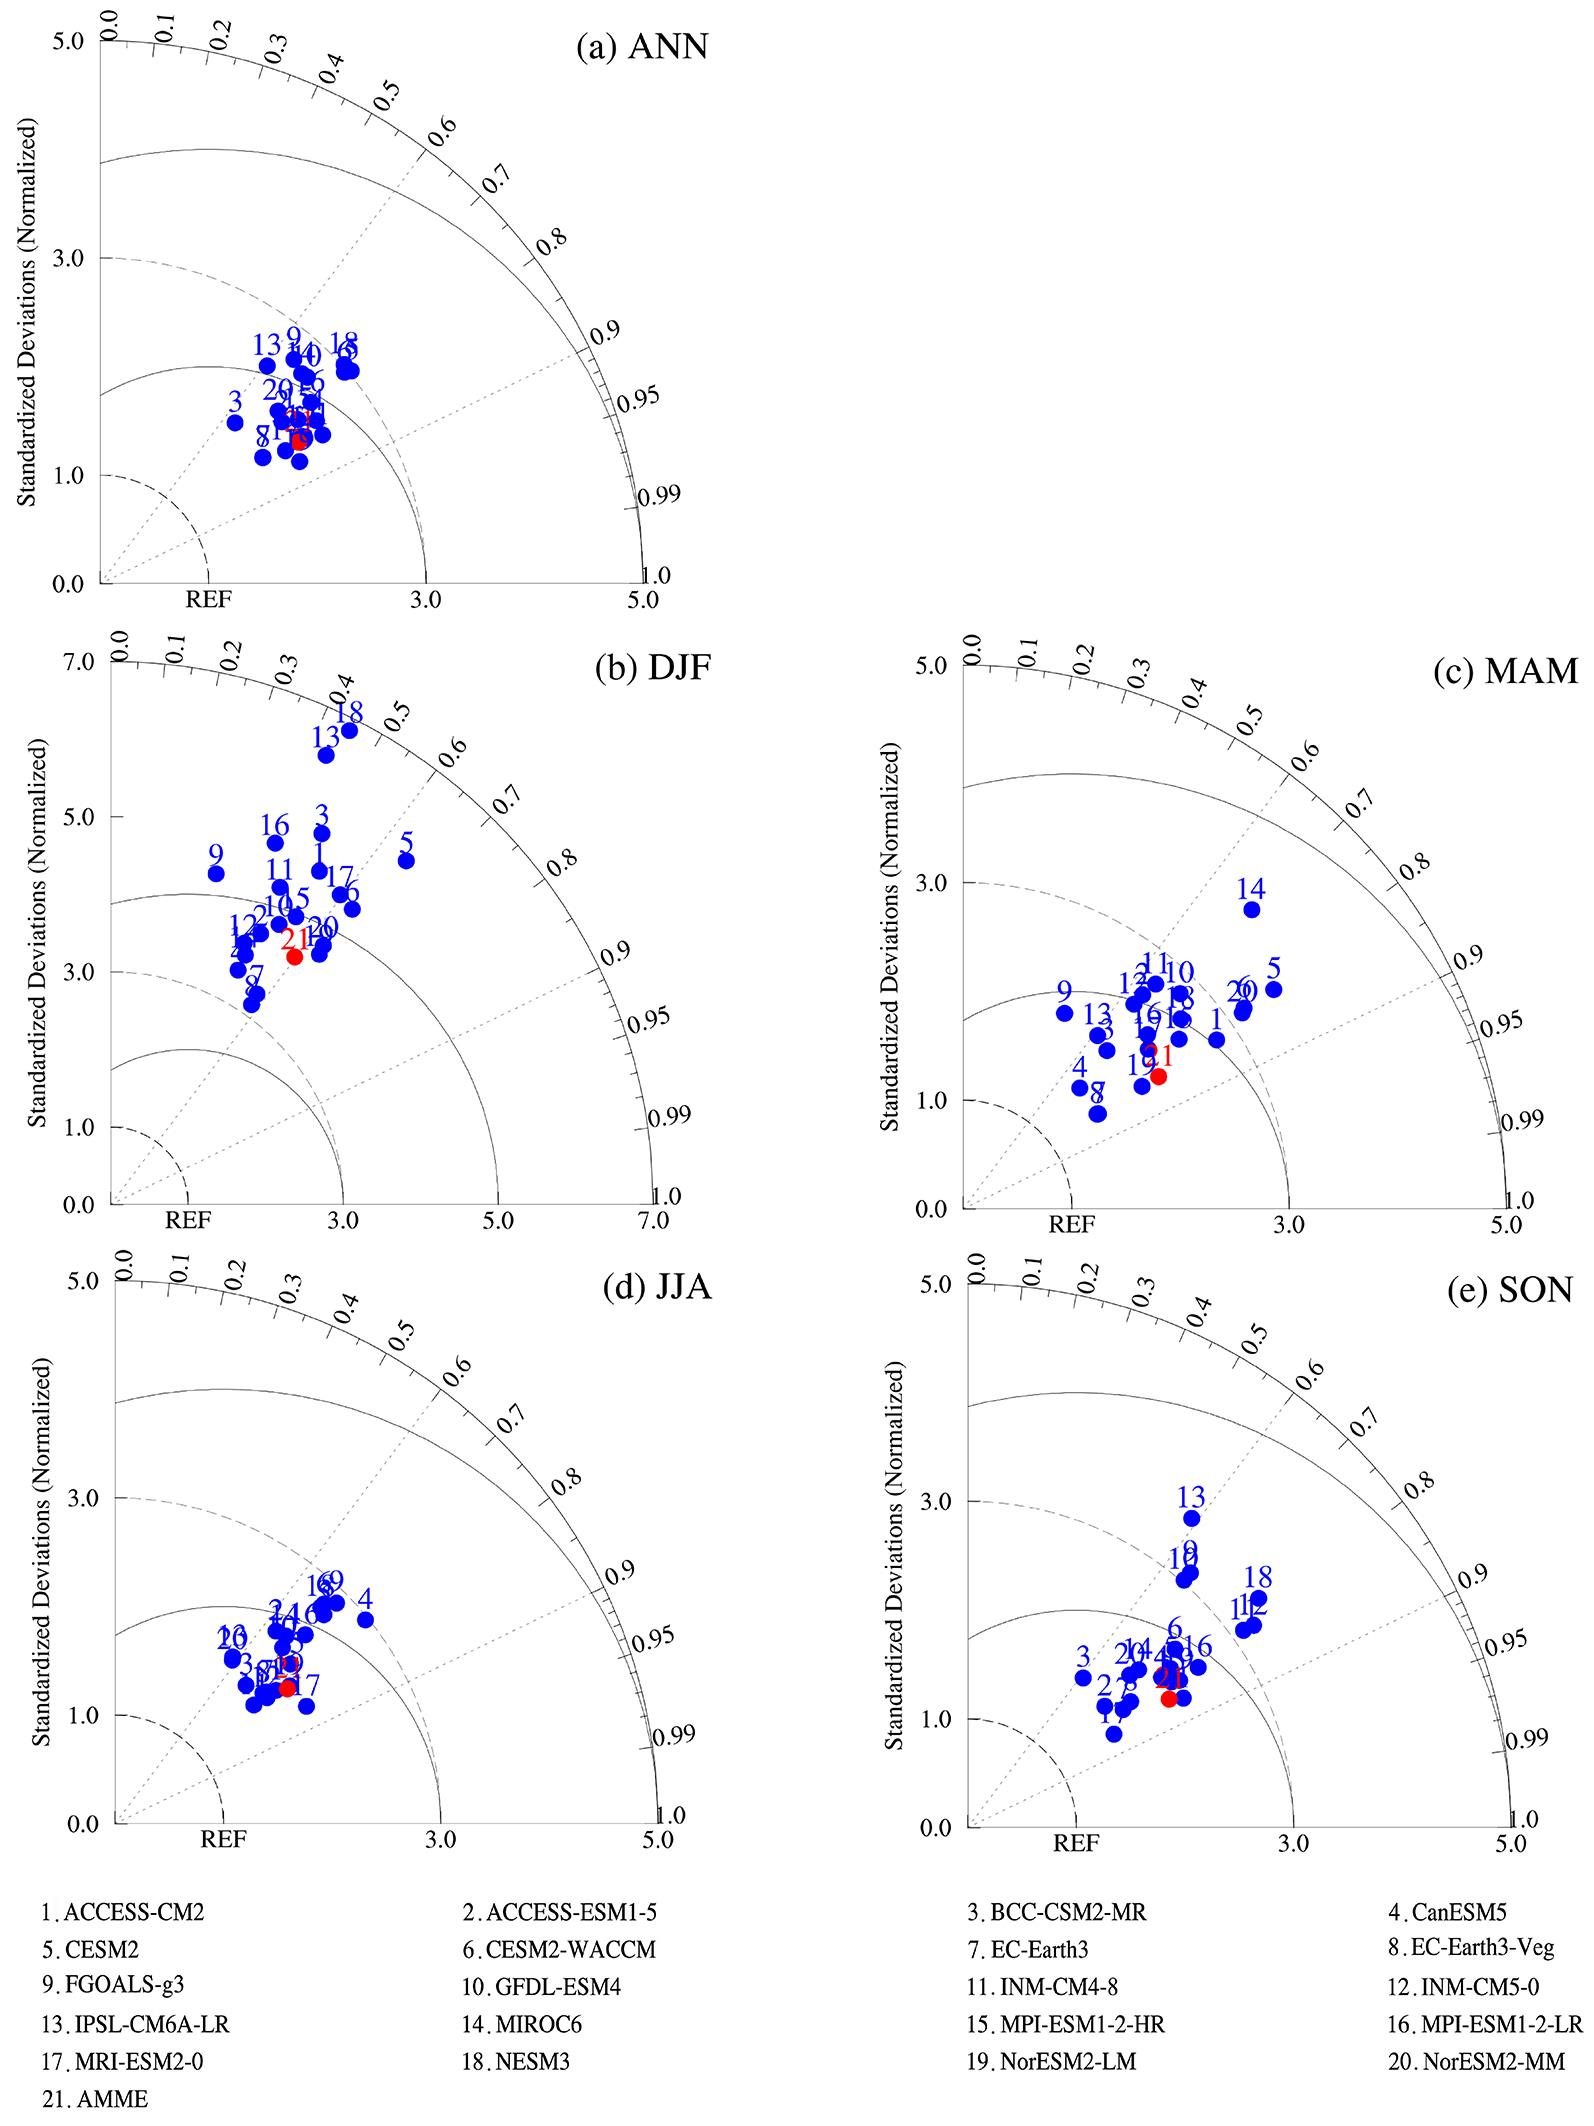
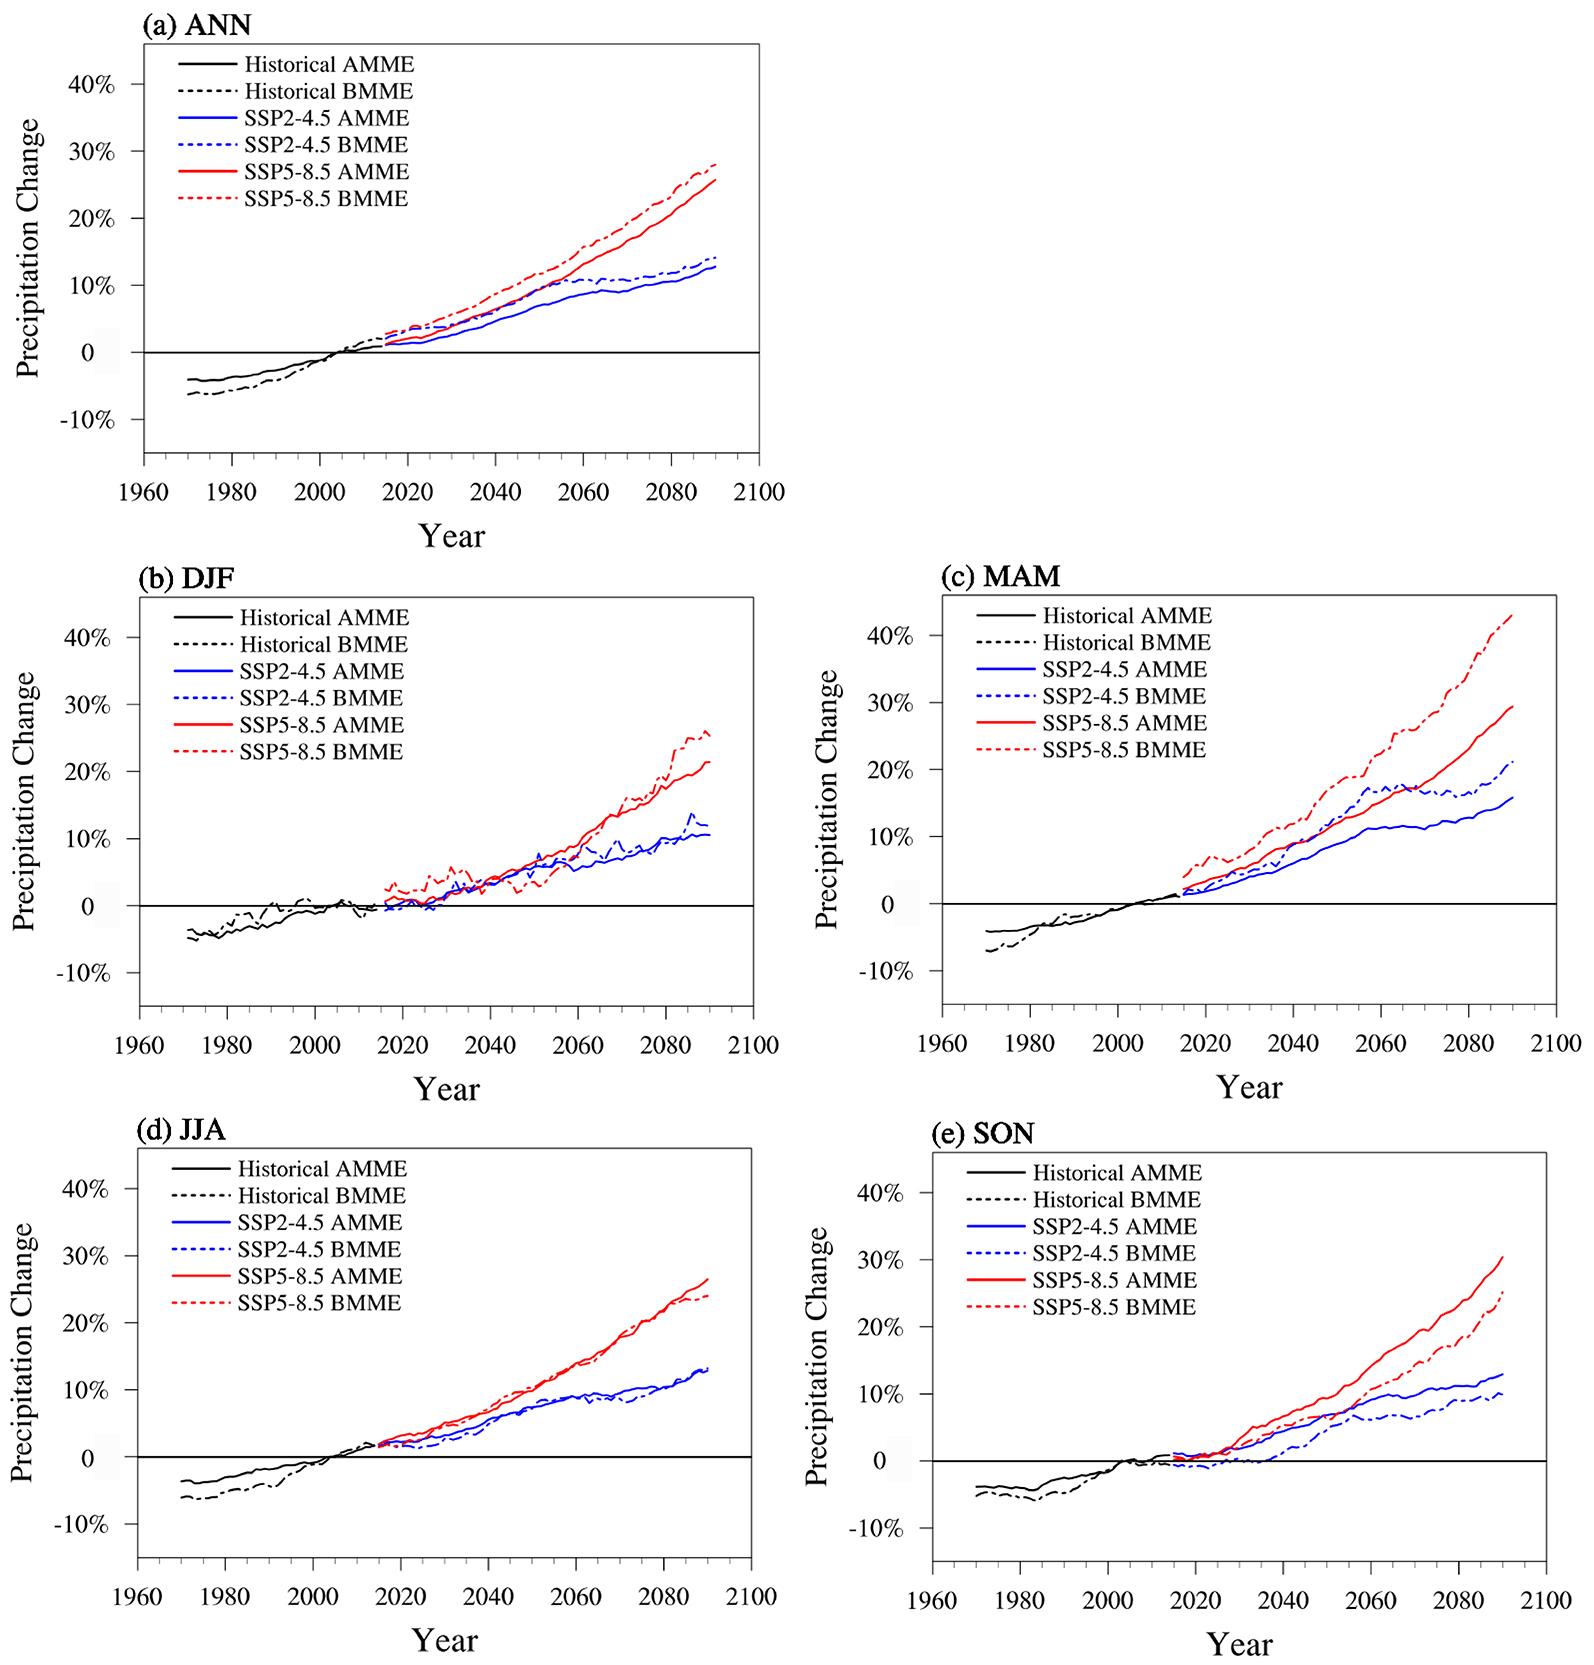
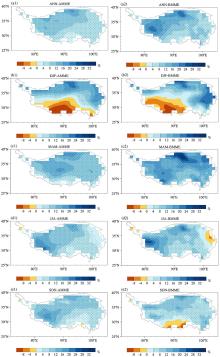
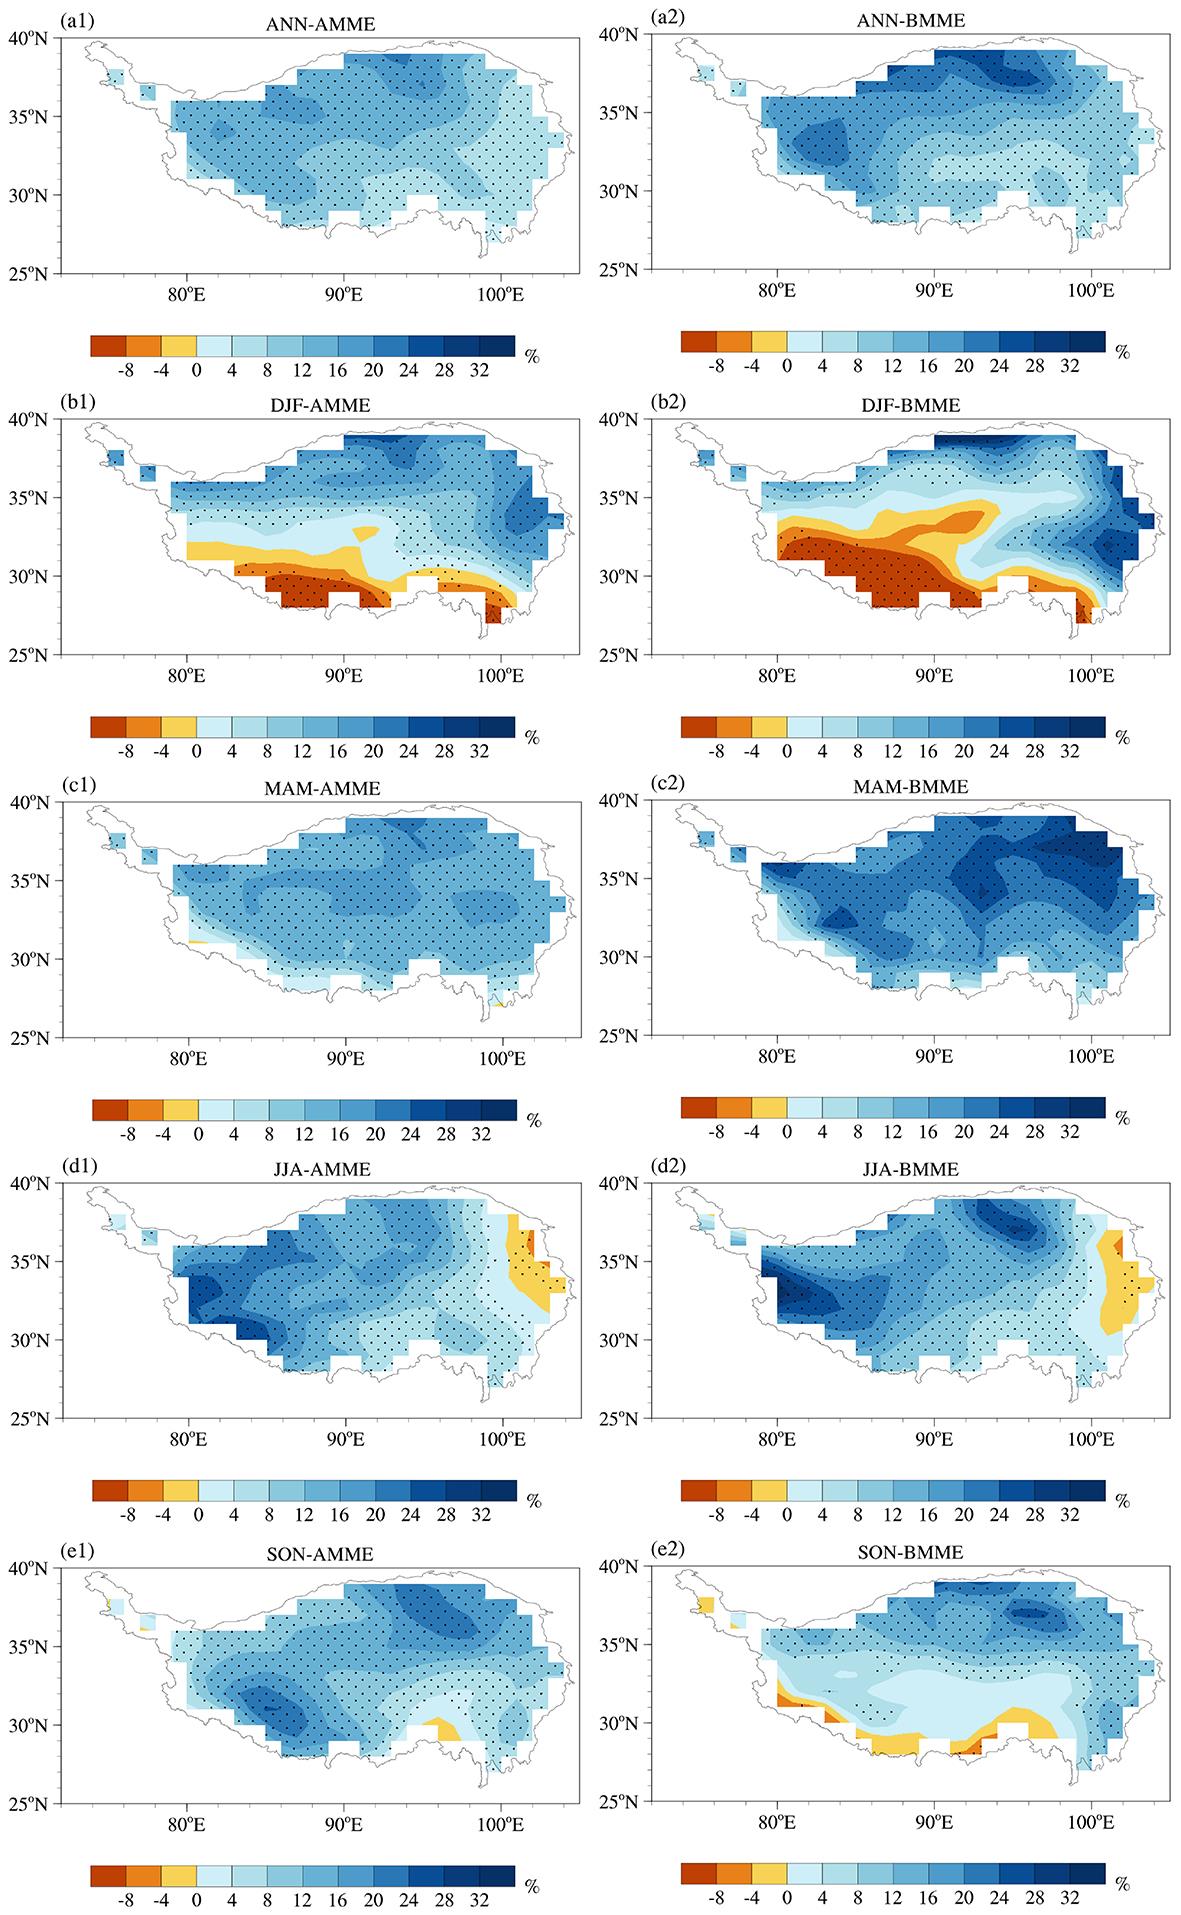
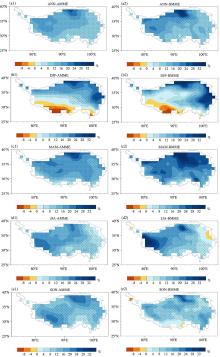
青藏高原降水对区域气候和水循环有着重要影响,在全球变暖的大背景下,研究青藏高原的降水分布及趋势变化十分必要.以1995-2014年青藏高原观测降水为基准态,评估第六次国际耦合模式比较计划(CMIP6)中20个模式对青藏高原年和季节平均降水的模拟能力.结果表明,CMIP6模式能够较好地模拟出青藏高原降水从东南向西北减少的空间分布特征,但模式模拟仍存在湿偏差,平均降水偏差达到1.3 mm·d-1.而且对于冬季模拟降水,模式之间存在较大的差异,模式标准差在3 mm·d-1以上.在共享社会经济路径SSP5?8.5和SSP2?4.5情景下,基于20个模式的模式集合(AMME)与择优选取的五个模式组成的集合(BMME)对中期(2045-2065年)和长期(2081-2100年)平均降水的未来预估,整体上青藏高原未来降水将有所增加,SSP5?8.5情景增幅大于SSP2?4.5,长期降水增幅大于中期.中期降水变化与长期分布一致,除了冬季和秋季南部地区、夏季东部地区表现为降水减少之外,其他大部分地区表现为全年和季节平均降水量的增加.BMME预估全年和季节平均降水增幅往往大于AMME.未来年平均降水的增加主要来源于春季降水的增加.
中图分类号:
- P448


| 1 | 张镱锂,李炳元,郑度. 论青藏高原范围与面积. 地理研究,2002,21(1):1-8. |
| Zhang Y L, Li B Y, Zheng D. A discussion on the boundary and area of the Tibetan Plateau in China. Geographical Research,2002,21(1):1-8. | |
| 2 | Qiu J. China:The third pole. Nature,2008,454(7203):393-396. |
| 3 | Xu X D, Lu C G, Shi X H,et al. World water tower:An atmospheric perspective. Geophysical Research Letters,2008,35(20):L20815. |
| 4 | 陆龙骅,卞林根,张正秋. 极地和青藏高原地区的气候变化及其影响. 极地研究,2011,23(2):82-89. |
| Lu L H, Bian L G, Zhang Z Q. Climate change and its impact of the polar and the Tibetan Plateau regions. Chinese Journal of Polar Research,2011,23(2):82-89. | |
| 5 | Mote P W, Salathé E P. Future climate in the Pacific Northwest. Climate Change,2010,102(1):29-50. |
| 6 | Phillips T J, Gleckler P J. Evaluation of continental precipitation in 20th century climate simulations:The utility of multimodel statistics. Water Resources Research,2006,42(3):W03202. |
| 7 | Su F G, Duan X L, Chen D L,et al. Evaluation of the global climate models in the CMIP5 over the Tibetan Plateau. Journal of Climate,2013,26(10):3187-3208. |
| 8 | Jia K, Ruan Y F, Yang Y Z,et al. Assessing the performance of CMIP5 global climate models for simulating future precipitation change in the Tibetan Plateau. Water,2019,11(9):1771. |
| 9 | 李振朝,韦志刚,吕世华,等. CMIP5部分模式气温和降水模拟结果在北半球及青藏高原的检验. 高原气象,2013,32(4):921-928. |
| Li Z C, Wei Z G, Lü S H,et al. Verifications of surface air temperature and precipitation from CMIP5 model in Northern Hemisphere and Qinghai?Xizang Plateau. Plateau Meteorology,2013,32(4):921-928. | |
| 10 | 梁玉莲,延晓冬. RCPs情景下中国21世纪气候变化预估及不确定性分析. 热带气象学报,2016,32(2):183-192. |
| Liang Y L, Yan X D. Prediction of climate change over China and uncertainty analysis during the 21st century under RCPs. Journal of Tro?pical Meteorology,2016,32(2):183-192. | |
| 11 | 胡芩,姜大膀,范广洲. 青藏高原未来气候变化预估:CMIP5模式结果. 大气科学,2015,39(2):260-270. |
| Hu Q, Jiang D B, Fan G Z. Climate change projection on the Tibetan Plateau:Results of CMIP5 models. Chinese Journal of Atmospheric Sciences,2015,39(2):260-270. | |
| 12 | 赵彦茜,肖登攀,柏会子. CMIP5气候模式对中国未来气候变化的预估和应用. 气象科技,2019,47(4):608-621. |
| Zhao Y X, Xiao D P, Bai H Z. Projection and application for future climate in China by CMIP5 climate model. Meteorological Science and Technology,2019,47(4):608-621. | |
| 13 | 张宏文,高艳红. 基于动力降尺度方法预估的青藏高原降水变化. 高原气象,2020,39(3):477-485. |
| Zhang H W, Gao Y H. Projected changes of precipitation over the Qinghai?Tibetan Plateau based on dynamical downscaling. Plateau Meteorology,2020,39(3):477-485. | |
| 14 | 张蓓,戴新刚. 2006-2013年CMIP5模式中国降水预估误差分析. 大气科学,2016,40(5):981-994. |
| Zhang B, Dai X G. Assessment of the deviation of China precipitation projected by CMIP5 models for 2006-2013. Chinese Journal of Atmospheric Sciences,2016,40(5):981-994. | |
| 15 | 周天军,邹立维,陈晓龙. 第六次国际耦合模式比较计划(CMIP6)评述. 气候变化研究进展,2019,15(5):445-456. |
| Zhou T J, Zou L W, Chen X L. Commentary on the coupled model intercomparison project phase 6 (CMIP6). Climate Change Research,2019,15(5):445-456. | |
| 16 | Zhu H H, Jiang Z H, Li J,et al. Does CMIP6 inspire more confidence in simulating climate extremes over China?. Advances in Atmospheric Sciences,2020,37(10):1119-1132. |
| 17 | Lei Y W, Chen J, Xiong L H. A comparison of CMIP5 and CMIP6 climate model projections for hydrological impacts in China. Hydrology Research,2023,54(3):330-347. |
| 18 | Jiang D B, Hu D, Tian Z P,et al. Differences between CMIP6 and CMIP5 models in simulating climate over China and the East Asian monsoon. Advances in Atmospheric Sciences,2020,37(10):1102-1118. |
| 19 | Zhu Y Y, Yang S N. Evaluation of CMIP6 for historical temperature and precipitation over the Tibetan Plateau and its comparison with CMIP5. Advances in Climate Change Research,2020,11(3):239-251. |
| 20 | 张丽霞,陈晓龙,辛晓歌. CMIP6情景模式比较计划(ScenarioMIP)概况与评述. 气候变化研究进展,2019,15(5):519-525. |
| Zhang L X, Chen X L, Xin X G. Short commentary on CMIP6 scenario model intercomparison project (ScenarioMIP). Climate Change Research,2019,15(5):519-525. | |
| 21 | 陈荣,段克勤,尚溦,等. 基于CMIP6模式数据的1961-2099年青藏高原降水变化特征分析. 高原气象,2023,42(2):294-304. |
| Chen R, Duan K Q, Shang W,et al. Characteristics of precipitation change over the Qinghai?Xizang Plateau from 1961 to 2099 based on CMIP6 models. Plateau Meteorology,2023,42(2):294-304. | |
| 22 | 陈炜,姜大膀,王晓欣. CMIP6模式对青藏高原气候的模拟能力评估与预估研究. 高原气象,2021,40(6):1455-1469. |
| Chen W, Jiang D B, Wang X X. Evaluation and projection of CMIP6 models for climate over the Qinghai?Xizang (Tibetan) Plateau. Plateau Meteorology,2021,40(6):1455-1469. | |
| 23 | 张佳怡,伦玉蕊,刘浏,等. CMIP6多模式在青藏高原的适应性评估及未来气候变化预估. 北京师范大学学报(自然科学版),2022,58(1):77-89. |
| Zhang J Y, Lun Y R, Liu L,et al. CMIP6 evaluation and projection of climate change in Tibetan Plateau. Journal of Beijing Normal University (Natural Science),2022,58(1):77-89. | |
| 24 | 李博渊,胡芩. 基于CMIP6模式评估结果对未来青藏高原降水多情景预估. 高原气象,2024,43(1):59-72. |
| Li B Y, Hu Q. Multi?scenario projection of future precipitation over the Qinghai?Xizang (Tibetan) Plateau based on CMIP6 model assessment results. Plateau Meteorology,2024,43(1):59-72. | |
| 25 | Yang X L, Zhou B T, Xu Y,et al. CMIP6 evaluation and projection of precipitation over northern China:Further investigation. Advances in Atmospheric Sciences,2023,40(4):587-600. |
| 26 | Yang X L, Zhou B T, Xu Y,et al. CMIP6 evaluation and projection of temperature and precipitation over China. Advances in Atmospheric Sciences,2021,38(5):817-830. |
| 27 | 吴佳,高学杰. 一套格点化的中国区域逐日观测资料及与其它资料的对比. 地球物理学报,2013,56(4):1102-1111. |
| Wu J, Gao X J. A gridded daily observation dataset over China region and comparison with the other datasets. Chinese Journal of Geophysics,2013,56(4):1102-1111. | |
| 28 | Taylor K E. Summarizing multiple aspects of model performance in a single diagram. Journal of Geophysical Research:Atmospheres,2001,106(D7):7183-7192. |
| 29 | 胡芩,姜大膀,范广洲. CMIP5全球气候模式对青藏高原地区气候模拟能力评估. 大气科学,2014,38(5):924-938. |
| Hu Q, Jiang D B, Fan G Z. Evaluation of CMIP5 models over the Qinghai?Tibetan Plateau. Chinese Journal of Atmospheric Sciences,2014,38(5):924-938. | |
| 30 | Zhou X, Yang K, Beljaars A,et al. Dynamical impact of parameterized turbulent orographic form drag on the simulation of winter precipitation over the western Tibetan Plateau. Climate Dynamics,2019,53(1-2):707-720. |
| No related articles found! |
|
||