南京大学学报(自然科学版) ›› 2023, Vol. 59 ›› Issue (6): 1003–1012.doi: 10.13232/j.cnki.jnju.2023.06.010

• •    

改进边界分类的Borderline‑SMOTE过采样方法

马贺1, 宋媚1,2(), 祝义1   

  1. 1.江苏师范大学计算机科学与技术学院,徐州,221116
    2.江苏师范大学管理科学与工程研究中心,徐州,221116
  • 收稿日期:2023-07-20 出版日期:2023-11-30 发布日期:2023-12-06
  • 通讯作者: 宋媚 E-mail:msong@jsnu.edu.cn
  • 基金资助:
    国家自然科学基金(71503108);CCF?华为创新研究计划(CCF?HuaweiFM202209);江苏师范大学科研与实践创新项目(2022XKT1540)

Improved Borderline⁃SMOTE oversampling method for boundary classification

He Ma1, Mei Song1,2(), Yi Zhu1   

  1. 1.School of Computer Science and Technology, Jiangsu Normal University, Xuzhou, 221116, China
    2.Management Science and Technology Center, Jiangsu Normal University, Xuzhou, 221116, China
  • Received:2023-07-20 Online:2023-11-30 Published:2023-12-06
  • Contact: Mei Song E-mail:msong@jsnu.edu.cn

摘要:

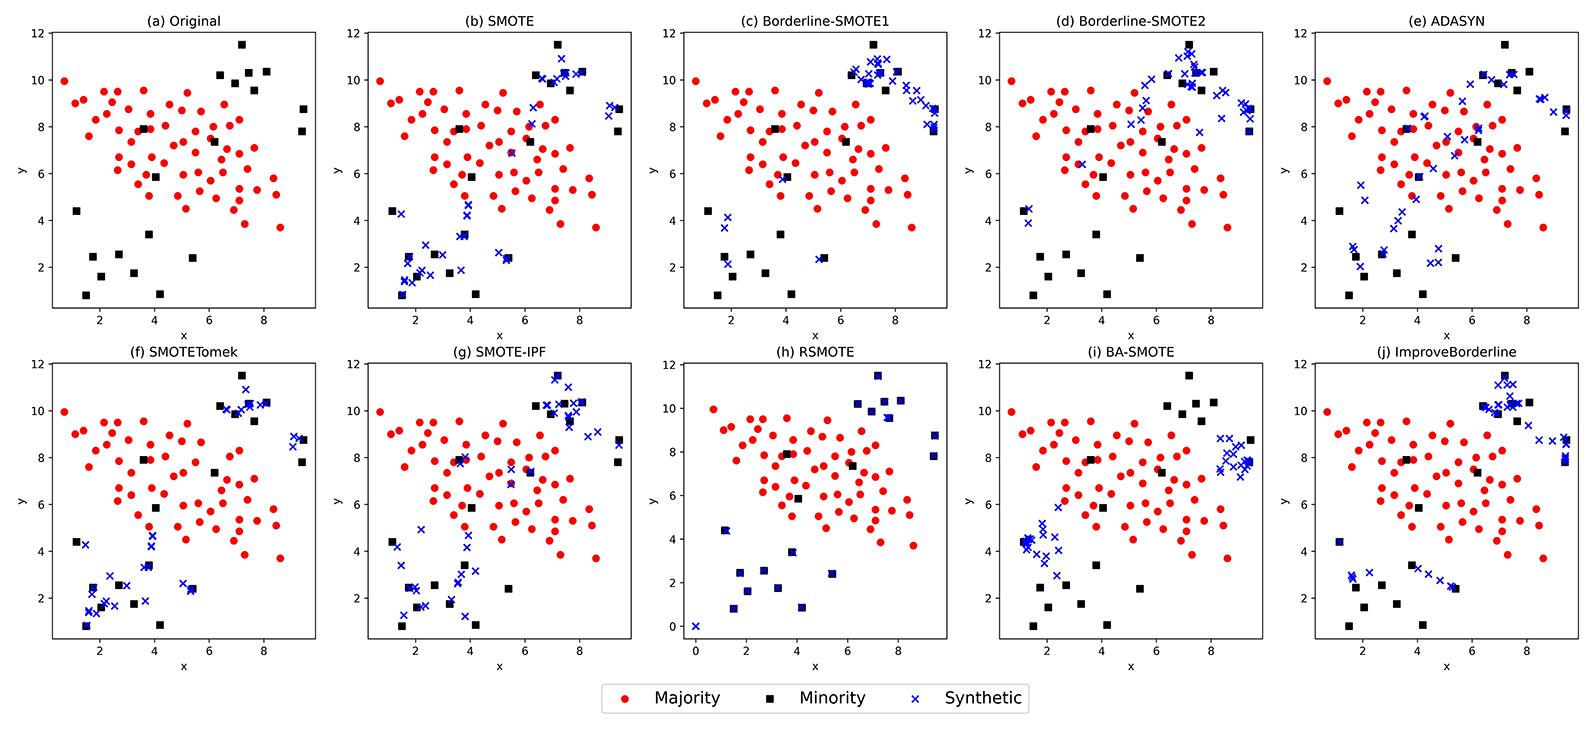
针对不平衡数据中类重叠区域易造成分类错误的问题,提出一种引入合成因子改进边界分类的Borderline?SMOTE过采样方法(IBSM).首先根据少数类样本近邻分布情况找出处于边界的少数类样本,然后计算边界样本对应的合成因子,并根据其取值更新该样本需生成的样本数,最后在近邻中根据合成因子挑选距离最近的top?Z少数类样本进行新样本生成.将提出的方法与八种采样方法在KNN和SVM两种分类器、10个KEEL不平衡数据集上进行对比实验,结果表明,提出的方法在大部分数据集上的F1,G?mean,AUC (Area under Curve)均获得最优值,且F1与AUC的Friedman排名最优,证明所提方法和其余采样方法相比,在处理不平衡数据中的边界样本分类问题时有更好的表现,通过合成因子设定一定的约束条件与分配策略,可以为同类研究提供思路.

关键词: 不平衡数据, 边界样本, 类重叠, Borderline?SMOTE, 过采样

Abstract:

An improved Borderline?SMOTE method (IBSM) is developed to solve the problem of class overlapping region in imbalanced data,using synthesis factor to augment the boundary classification. Firstly,the minority samples that are at the boundary are identified according to the distribution of the samples' nearest neighbors. Then,the synthesis factor corresponding to the boundary samples is calculated,and the number of samples to be generated is updated according to its value. Finally,the top?Z minority samples are selected among the nearest neighbors to generate new samples according to the synthesis factor. The proposed method is compared with eight sampling methods by experiments using KNN and SVM classifiers on 10 KEEL imbalanced datasets. Experimental results show that the proposed method performs better than the others in handling the problem of boundary samples classification in imbalanced data. It obtains optimal values of F1,G?mean,AUC (Area under Curve) and the Friedman rankings on most datasets. This paper provides references for similar studies by using synthesis factor to set the constraints and allocation strategies.

Key words: imbalance data, boundary sample, class overlap, Borderline?SMOTE, oversampling

中图分类号: 

  • TP181

表1

二分类混淆矩阵"

预测为正类预测为负类
实际为正类TPFN
实际为负类FPTN

图1

受不平衡数量差和边界样本数影响的δ值变化图"

图2

不同采样方法在toy数据集上采样后数据分布情况"

图3

不同采样方法在circles数据集上采样后数据分布情况"

图4

不同采样方法在moons数据集上采样后数据分布情况"

表2

公开数据集信息"

数据集名称样本个数

特征

维数

不平

衡率

简称
wisconsin68391.86Wis
pima76881.87Pi
haberman30632.78Haber
glass‑0‑1‑2‑3_vs_4‑5‑621493.20Glass
segment02308196.02Seg
led7digit‑0‑2‑4‑5‑6‑7‑8‑9_vs_1443710.97Led
ecoli4336715.80Eco
yeast51484832.73Yea5
yeast61484841.40Yea6
shuttle‑2_vs_53316966.67Shu

表3

IBSM和八种对比方法在10个KEEL数据集上的F1对比"

数据集分类器SMOBS1BS2ADASTIPFRSBAIBSM
Wis

KNN

SVM

0.9719

0.9596

0.9547

0.9535

0.9458

0.9470

0.9571

0.9548

0.9707

0.9583

0.9639

0.9596

0.9571

0.9584

0.9573

0.9576

0.9650

0.9631

Pi

KNN

SVM

0.6234

0.6498

0.6297

0.6634

0.6373

0.6522

0.6198

0.6460

0.6261

0.6534

0.6294

0.6561

0.6224

0.6401

0.6383

0.6529

0.6453

0.6645

Haber

KNN

SVM

0.4116

0.4379

0.3989

0.4351

0.4214

0.4133

0.3842

0.4392

0.4136

0.4438

0.4152

0.4281

0.3706

0.4167

0.3939

0.4451

0.4455

0.4611

Glass

KNN

SVM

0.8757

0.8355

0.8773

0.8217

0.8877

0.8361

0.8704

0.8357

0.8711

0.8386

0.8726

0.8330

0.8718

0.8570

0.8899

0.8029

0.8961

0.8353

Seg

KNN

SVM

0.9239

0.9888

0.9365

0.9879

0.8588

0.9188

0.9284

0.9889

0.9239

0.9878

0.9265

0.9858

0.9345

0.9868

0.9200

0.9301

0.9424

0.9889

Led

KNN

SVM

0.5818

0.7913

0.6130

0.6437

0.4725

0.6494

0.5867

0.6872

0.5818

0.7913

0.6844

0.8027

0.3926

0.8339

0.7313

0.8326

0.7953

0.8406

Eco

KNN

SVM

0.8167

0.8354

0.7900

0.8309

0.6612

0.7389

0.7755

0.8059

0.8167

0.8354

0.8055

0.8176

0.8737

0.8779

0.7457

0.8118

0.8428

0.8871

Yea5

KNN

SVM

0.6291

0.5264

0.6291

0.5258

0.4163

0.3645

0.6230

0.5289

0.6291

0.5264

0.6364

0.5264

0.6429

0.5615

0.5877

0.5078

0.6637

0.6106

Yea6

KNN

SVM

0.3480

0.3763

0.4826

0.4563

0.3556

0.3815

0.3237

0.3039

0.3496

0.3763

0.3666

0.3840

0.5146

0.4452

0.4507

0.4254

0.5221

0.5129

Shu

KNN

SVM

0.9450

1.0000

0.9584

1.0000

0.9108

0.9456

0.9584

1.0000

0.9450

1.0000

0.9450

1.0000

0.9450

1.0000

0.9316

0.9256

0.9584

1.0000

表4

IBSM和八种对比方法在10个KEEL数据集上的G?mean对比"

数据集分类器SMOBS1BS2ADASTIPFRSBAIBSM
Wis

KNN

SVM

0.9840

0.9741

0.9727

0.9732

0.9673

0.9694

0.9749

0.9740

0.9832

0.9729

0.9756

0.9728

0.9686

0.9710

0.9750

0.9755

0.9780

0.9763

Pi

KNN

SVM

0.6957

0.7223

0.6946

0.7266

0.7028

0.7162

0.6857

0.7147

0.6970

0.7253

0.6998

0.7279

0.6970

0.7144

0.6992

0.7182

0.7061

0.7241

Haber

KNN

SVM

0.5722

0.5709

0.5577

0.5853

0.5792

0.5490

0.5460

0.5678

0.5742

0.5785

0.5734

0.5566

0.5294

0.5352

0.5549

0.5717

0.6010

0.5774

Glass

KNN

SVM

0.9435

0.9065

0.9380

0.9103

0.9423

0.9225

0.9449

0.9191

0.9447

0.9161

0.9382

0.9052

0.9347

0.9181

0.9419

0.8879

0.9500

0.9156

Seg

KNN

SVM

0.9809

0.9947

0.9840

0.9955

0.9710

0.9796

0.9816

0.9957

0.9809

0.9937

0.9814

0.9926

0.9820

0.9927

0.9776

0.9859

0.9827

0.9931

Led

KNN

SVM

0.7800

0.9127

0.8355

0.8772

0.7439

0.8582

0.8209

0.8946

0.7800

0.9127

0.9071

0.9143

0.5483

0.9183

0.8486

0.9111

0.9196

0.9191

Eco

KNN

SVM

0.9503

0.9288

0.9472

0.9289

0.9323

0.9321

0.9462

0.9267

0.9503

0.9288

0.9494

0.9278

0.9556

0.9446

0.9429

0.9493

0.9424

0.9456

Yea5

KNN

SVM

0.9367

0.9211

0.9367

0.9403

0.9274

0.9006

0.9362

0.9408

0.9367

0.9211

0.9434

0.9211

0.9376

0.9499

0.9273

0.9427

0.9250

0.9092

Yea6

KNN

SVM

0.7865

0.8394

0.7885

0.8502

0.8478

0.8827

0.7833

0.8338

0.7868

0.8394

0.7980

0.8304

0.7795

0.7795

0.7902

0.8334

0.7572

0.7746

Shu

KNN

SVM

0.9992

1.0000

0.9994

1.0000

0.9985

0.9992

0.9994

1.0000

0.9992

1.0000

0.9992

1.0000

0.9992

1.0000

0.9986

0.9986

0.9994

1.0000

表5

IBSM和八种对比方法在10个KEEL数据集上的AUC对比"

数据集分类器SMOBS1BS2ADASTIPFRSBAIBSM
Wis

KNN

SVM

0.9841

0.9742

0.9730

0.9736

0.9677

0.9699

0.9752

0.9744

0.9833

0.9730

0.9757

0.9729

0.9687

0.9711

0.9753

0.9758

0.9781

0.9764

Pi

KNN

SVM

0.6959

0.7245

0.6972

0.7292

0.7050

0.7190

0.6879

0.7156

0.6976

0.7270

0.7002

0.7295

0.6976

0.7168

0.7083

0.7200

0.7104

0.7291

Haber

KNN

SVM

0.5837

0.6274

0.5721

0.6122

0.5853

0.5838

0.5526

0.6150

0.5827

0.6300

0.5807

0.6253

0.5757

0.6234

0.5759

0.6237

0.6043

0.6218

Glass

KNN

SVM

0.9439

0.9075

0.9384

0.9111

0.9426

0.9228

0.9456

0.9196

0.9451

0.9166

0.9386

0.9062

0.9359

0.9188

0.9427

0.8894

0.9503

0.9162

Seg

KNN

SVM

0.9809

0.9948

0.9841

0.9955

0.9705

0.9797

0.9817

0.9957

0.9809

0.9937

0.9814

0.9926

0.9820

0.9928

0.9778

0.9858

0.9827

0.9957

Led

KNN

SVM

0.8050

0.9157

0.8440

0.8800

0.7634

0.8622

0.8383

0.8966

0.8050

0.9157

0.9082

0.9174

0.6440

0.9215

0.8605

0.9130

0.9215

0.9223

Eco

KNN

SVM

0.9522

0.9331

0.9490

0.9331

0.9343

0.9348

0.9480

0.9310

0.9522

0.9331

0.9512

0.9321

0.9575

0.9474

0.9448

0.9511

0.9454

0.9485

Yea5

KNN

SVM

0.9377

0.9233

0.9377

0.9409

0.9275

0.9014

0.9372

0.9413

0.9377

0.9233

0.9443

0.9233

0.9386

0.9505

0.9233

0.9316

0.9276

0.9120

Yea6

KNN

SVM

0.8001

0.8469

0.8063

0.8570

0.8516

0.8849

0.7962

0.8419

0.8004

0.8469

0.8098

0.8407

0.8007

0.8004

0.8244

0.8440

0.7842

0.7981

Shu

KNN

SVM

0.9992

1.0000

0.9994

1.0000

0.9985

0.9992

0.9994

1.0000

0.9992

1.0000

0.9992

1.0000

0.9992

1.0000

0.9986

0.9986

0.9994

1.0000

表6

IBSM和八种对比方法的Friedman排名对比"

评价指标分类器SMOBS1BS2ADASTIPFRSBAIBSM
F1

KNN

SVM

5.35

4.8

4.4

5.5

6.7

7.6

6.65

5.55

5.15

4.45

4.45

5.05

5.4

4.1

5.4

6.1

1.5

1.85

G‑mean

KNN

SVM

4.8

4.75

4.9

3.9

6.1

6.5

5.5

4.9

4.35

4.35

3.75

5.8

6

5.3

5.9

5.3

3.7

4.2

AUC

KNN

SVM

4.8

4.6

5

4.7

6.4

6.6

5.7

5.05

4.55

4.4

4.05

5.4

5.5

4.8

5.6

5.4

3.4

4.05

1 Chao X R, Kou G, Peng Y,et al. An efficiency curve for evaluating imbalanced classifiers considering intrinsic data characteristics:Experimental analysis. Information Sciences,2022(608):1131-1156.
2 Chen L, Jia N, Zhao H K,et al. Refined analysis and a hierarchical multi?task learning approach for loan fraud detection. Journal of Management Science and Engineering,2022,7(4):589-607.
3 Gao Y X, Zhu Y, Zhao Y. Dealing with imbalanced data for interpretable defect prediction. Information and Software Technology,2022(151):107016.
4 Al S, Dener M. STL?HDL:A new hybrid network intrusion detection system for imbalanced dataset on big data environment. Computers & Security,2021(110):102435.
5 Milosevic M S, Ciric V M. Extreme minority class detection in imbalanced data for network intrusion. Computers & Security,2022(123):102940.
6 Rai H M, Chatterjee K. Hybrid CNN?LSTM deep learning model and ensemble technique for automatic detection of myocardial infarction using big ECG data. Applied Intelligence,2022,52(5):5366-5384.
7 Chawla N V, Bowyer K W, Hall L O,et al. SMOTE:Synthetic minority over?sampling technique. Journal of Artificial Intelligence Research,2002(16):321-357.
8 周玉,孙红玉,房倩,等. 不平衡数据集分类方法研究综述. 计算机应用研究,2022,39(6):1615-1621.
Zhou Y, Sun H Y, Fang Q,et al. Review of imba?lanced data classification methods. Application Research of Computers,2022,39(6):1615-1621.
9 Han H, Wang W Y, Mao B H. Borderline?SMOTE:A new over?sampling method in imbalanced data sets learning∥Proceeding of 2005 International Conference on Advances in Intelligent Computing. Hefei,China Springer,2005:878-887.
10 He H B, Bai Y, Garcia E A,et al. ADASYN:Adaptive synthetic sampling approach for imbalanced learning∥2008 IEEE International Joint Conference on Neural Networks. Hong Kong,China:IEEE,2008:1322-1328.
11 陈海龙,杨畅,杜梅,等. 基于边界自适应SMOTE和Focal Loss函数改进LightGBM的信用风险预测模型. 计算机应用,2022,42(7):2256-2264.
Chen H L, Yang C, Du M,et al. Credit risk prediction model based on borderline adaptive SMOTE and Focal Loss improved LightGBM. Journal of Computer Applications,2022,42(7):2256-2264.
12 陶佳晴,贺作伟,冷强奎,等. 基于Tomek链的边界少数类样本合成过采样方法. 计算机应用研究,2023,40(2):463-469.
Tao J Q, He Z W, Leng Q K,et al. Synthetic oversampling method for boundary minority samples based on Tomek links. Application Research of Computers,2023,40(2):463-469.
13 高雷阜,张梦瑶,赵世杰. 融合簇边界移动与自适应合成的混合采样算法. 电子学报,2022,50(10):2517-2529.
Gao L F, Zhang M Y, Zhao S J. Mixed?sampling algorithm combining cluster boundary movement and adaptive synthesis. Acta Electronica Sinica,2022,50(10):2517-2529.
14 Xu Z Z, Shen D R, Nie T Z,et al. A cluster?based oversampling algorithm combining SMOTE and k?means for imbalanced medical data. Information Sciences,2021(572):574-589.
15 陈俊丰,郑中团. WKMeans与SMOTE结合的不平衡数据过采样方法. 计算机工程与应用,2021,57(23):106-112.
Chen J F, Zheng Z T. Over?sampling method on imbalanced data based on WKMeans and SMOTE. Computer Engineering and Applications,2021,57(23):106-112.
16 Chen B Y, Xia S Y, Chen Z Z,et al. RSMOTE:A self?adaptive robust SMOTE for imbalanced problems with label noise. Information Sciences,2021(553):397-428.
17 Batista G E A P A, Prati R C, Monard M C. A study of the behavior of several methods for balancing machine learning training data. ACM SIGKDD Explorations Newsletter,2004,6(1):20-29.
18 Sáez J A, Luengo J, Stefanowski J,et al. SMOTE?IPF:Addressing the noisy and borderline examples problem in imbalanced classification by a re?sampling method with filtering. Information Sciences,2015(291):184-203.
19 Dou J, Gao Z, Wei G,et al. Switching synthesizing?incorporated and cluster?based synthetic over?sampling for imbalanced binary classification. Engineering Applications of Artificial Intelligence2023(123):106193.
20 Douzas G, Bacao F, Last F. Improving imbalanced learning through a heuristic oversampling method based on k?means and SMOTE. Information Sciences,2018(465):1-20.
21 Palakonda V, Kang J M, Jung H. An adaptive neighborhood based evolutionary algorithm with pivot?solution based selection for multi? and many?objective optimization. Information Sciences,2022(607):126-152.
22 Rivera W A. Noise reduction a priori synthetic over?sampling for class imbalanced data sets. Information Sciences,2017(408):146-161.
[1] 吕佳, 郭铭. 基于密度峰值聚类和局部稀疏度的过采样算法[J]. 南京大学学报(自然科学版), 2022, 58(3): 483-494.
[2] 程永林, 李德玉, 王素格. 基于极大相容块的邻域粗糙集模型[J]. 南京大学学报(自然科学版), 2019, 55(4): 529-536.
[3]  赵小强1,2,3*,张 露1.  基于SVM的高维不平衡数据集分类算法[J]. 南京大学学报(自然科学版), 2018, 54(2): 452-.
[4] 朱亚奇1,邓维斌1 ,2*. 一种基于不平衡数据的聚类抽样方法[J]. 南京大学学报(自然科学版), 2015, 51(2): 421-429.
[5] 朱亚奇1,邓维斌1,2*. 一种基于不平衡数据的聚类抽样方法[J]. 南京大学学报(自然科学版), 2015, 51(2): 421-429.
Viewed
Full text


Abstract

Cited

  Shared   
  Discussed   
No Suggested Reading articles found!