台风结构与强度以及环境场对西北太平洋台风尺度估计的影响研究
The impact of typhoon structure, intensity, and environmental factors on the estimation of typhoon size in the Northwest Pacific
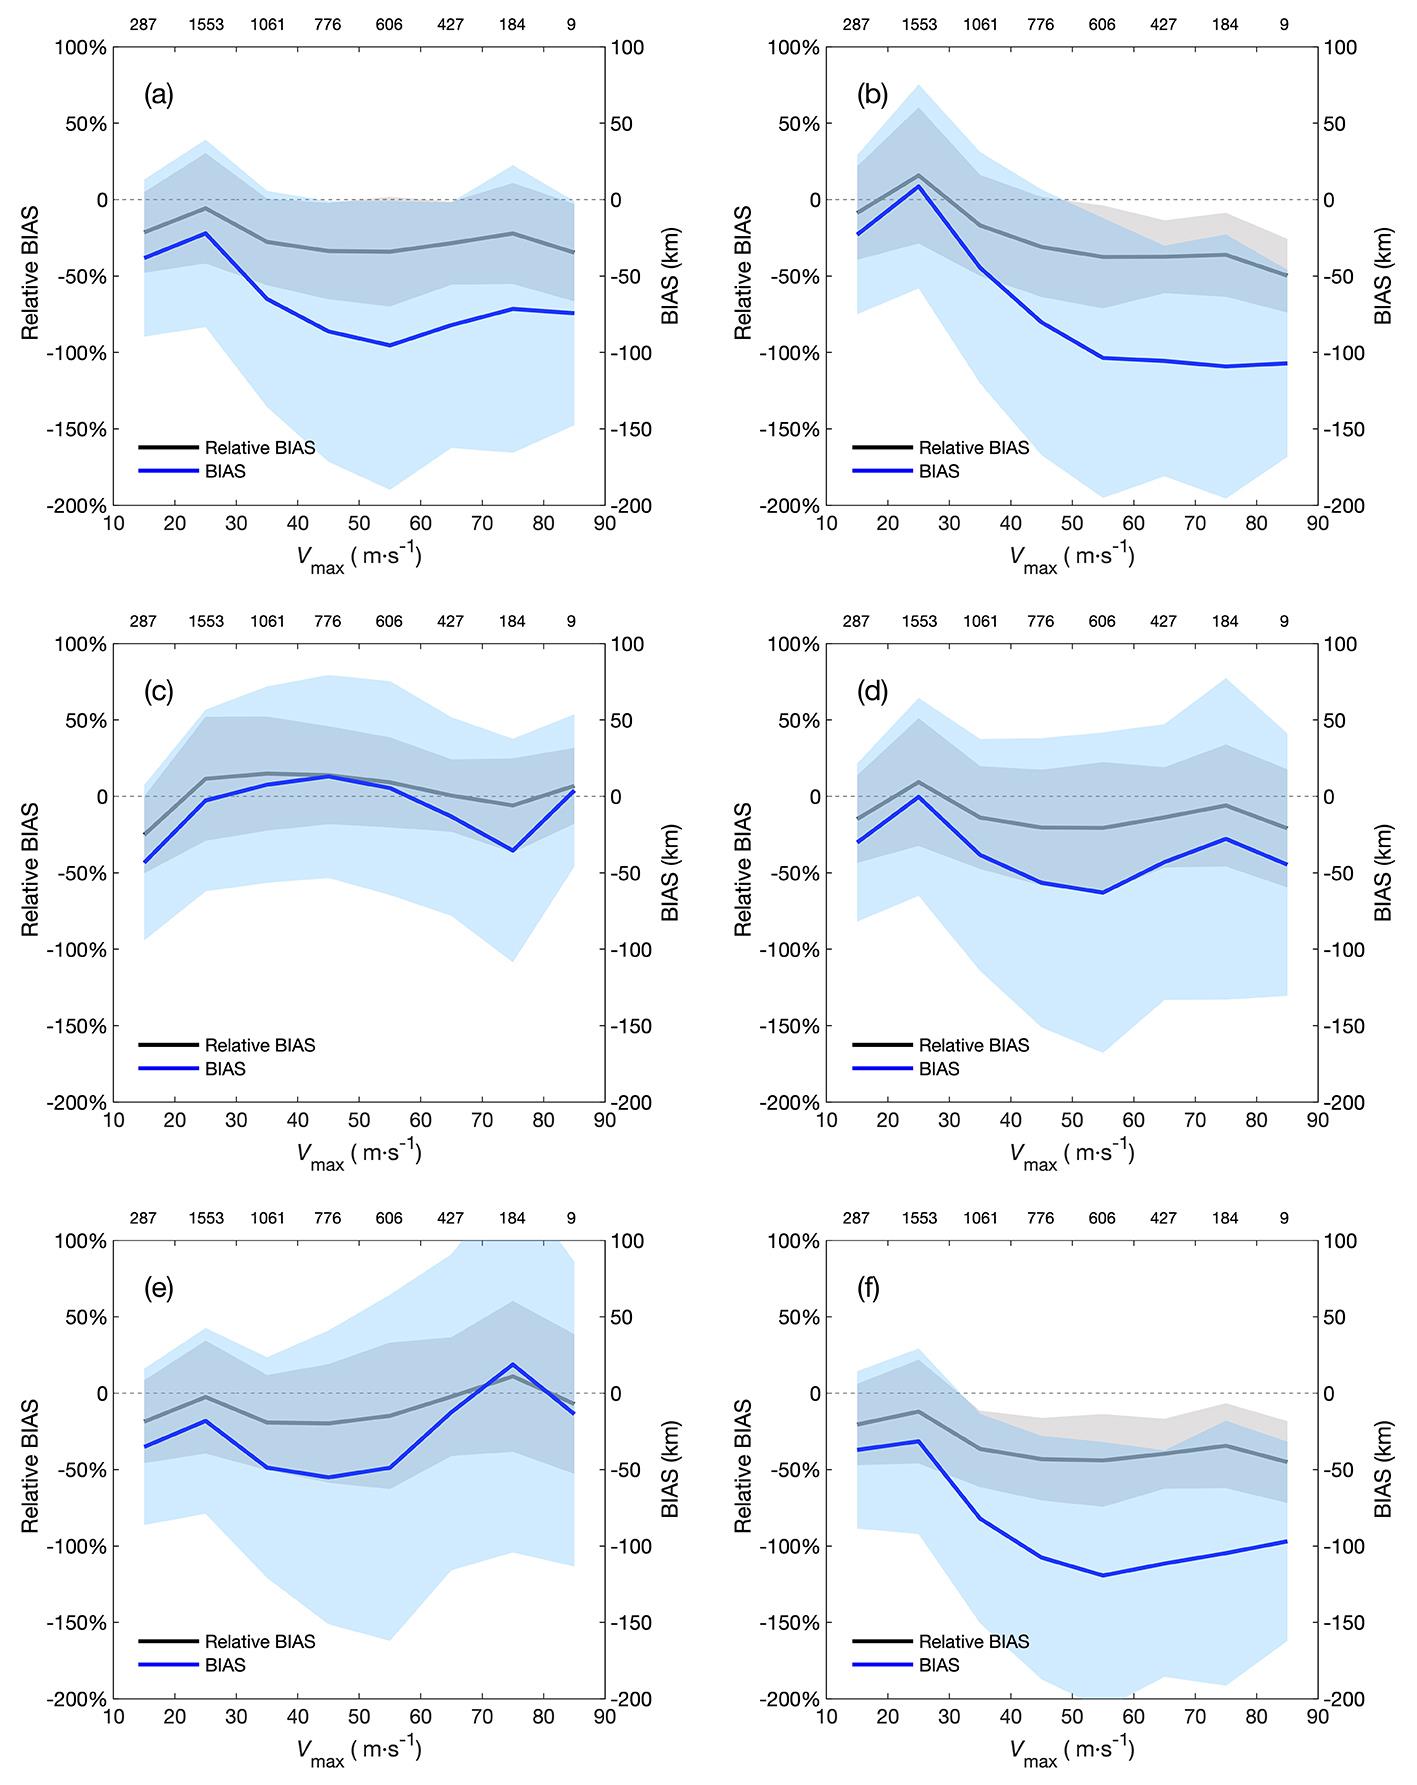
The solid blue and black lines represent BIAS and Relative BIAS respectively. Blue and gray shaded areas indicate the distribution of standard deviations for BIAS and Relative BIAS. The gray dashed line indicates the position of the zero value,and the top row of numbers represents the sample for each group,and the top row of numbers represents the sample for each group.
(a) H80, (b) D87, (c) W06, (d) F13, (e) C15, (f) W16