超强台风“鲇鱼”形成过程中的水汽演变特征
Moisture evolution during the pre⁃genesis of Super Typhoon Megi (2010)
超强台风“鲇鱼”形成过程中的水汽演变特征 |
| 卓立,吴钲,方德贤,方娟 |
|
Moisture evolution during the pre⁃genesis of Super Typhoon Megi (2010) |
| Li Zhuo,Zheng Wu,Dexian Fang,Juan Fang |
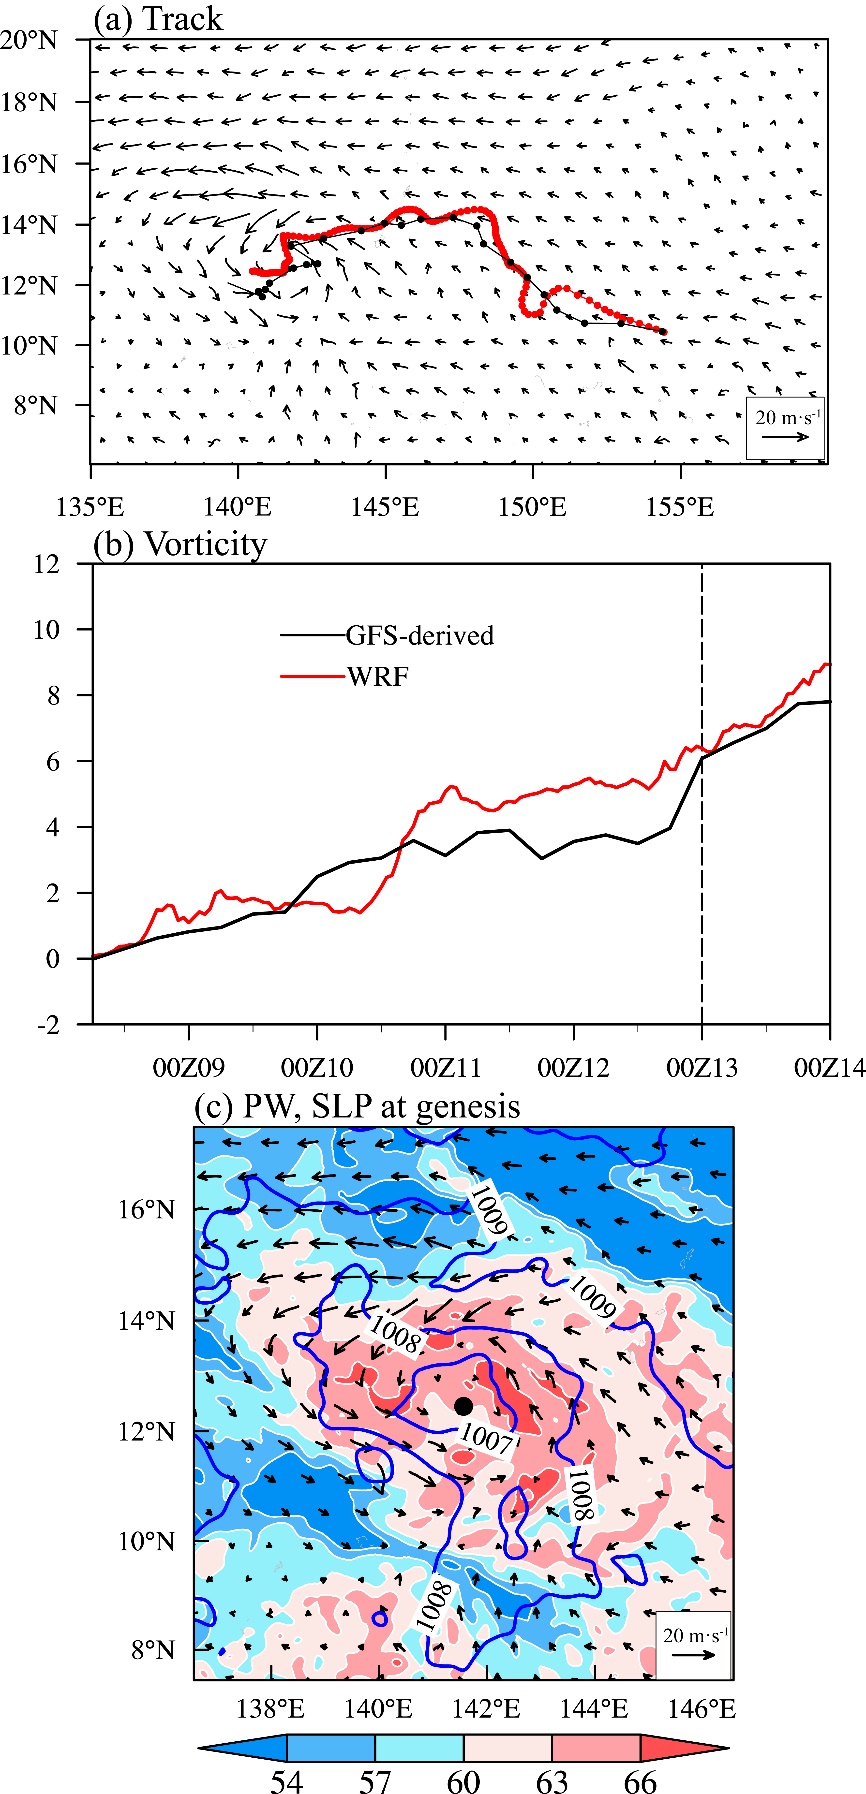
| 图1 (a)控制试验模拟的“Megi”台风前期扰动的移动路径(红色)、由GFS再分析场得到的前期扰动路径(黑色)以及2010年10月13日00时1000 hPa的水平风场,系统的路径使用涡度质心的计算方法确定,涡度取为1000~600 hPa的平均涡度;(b)距前期扰动中心200 km范围内的850 hPa平均涡度随时间的变化(单位:10-5 s-1),垂直虚线对应时间为台风形成时时刻;(c)2010年10月13日00时控制试验模拟的可降水量(填色,单位:kg?m-2)、海平面气压(线条,单位:hPa)和1000 hPa水平风场,黑点表示台风中心 |
| Fig.1 (a) Model?derived (red circles) and GFS?derived (black circles) tracks of the disturbance,overlaid by the simulated 1000 hPa wind (vectors) at 0000 UTC 13 October,the location of the disturbance is defined as the centroid of the average vorticity from 1000 to 600 hPa,(b) area?mean vorticity (units: 10-5 s-1) at 850 hPa within 200 km radius of the disturbance center,the vertical dashed line denotes the genesis time (0000 UTC 13 October,from the JMA),(c) precipitable water (shading, units: kg?m-2) overlaid by the sea level pressure (lines, units: hPa) and 1000 hPa winds (vectors) at 0000 UTC 13 October,the black dot denotes the center of the disturbance |
|
|